. 2012 Feb 1;59(3):2073-87.
doi: 10.1016/j.neuroimage.2011.10.042. Epub 2011 Oct 20.

Statistical feature extraction for artifact removal from concurrent fMRI-EEG recordings

Affiliations

Statistical feature extraction for artifact removal from concurrent fMRI-EEG recordings

Zhongming Liu et al. Neuroimage. .

Abstract

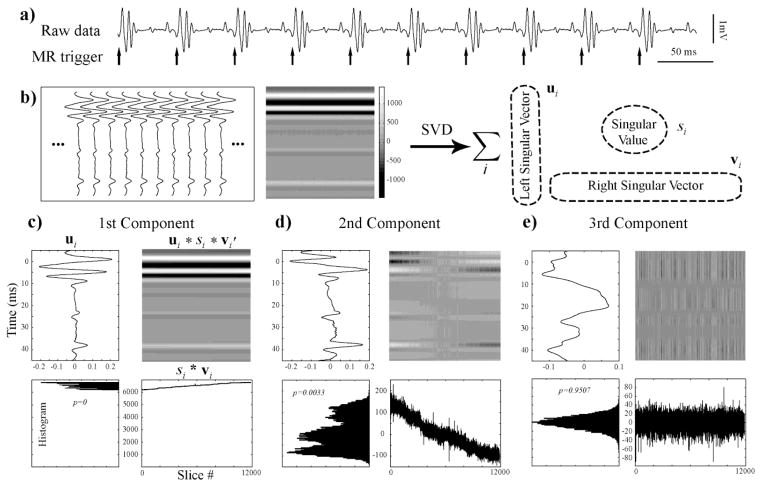
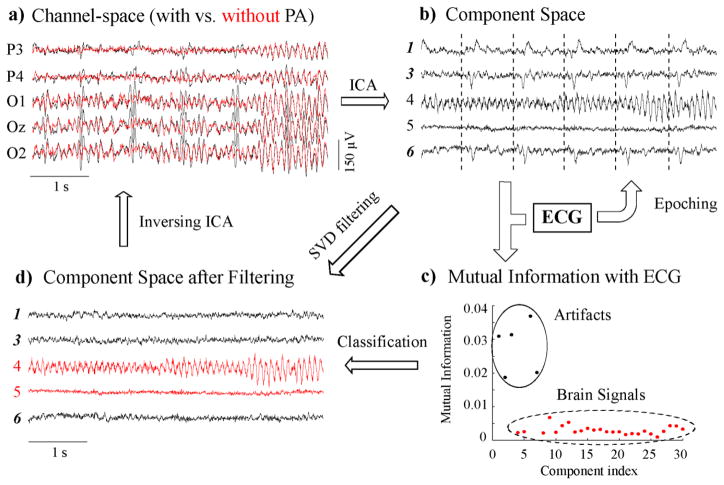
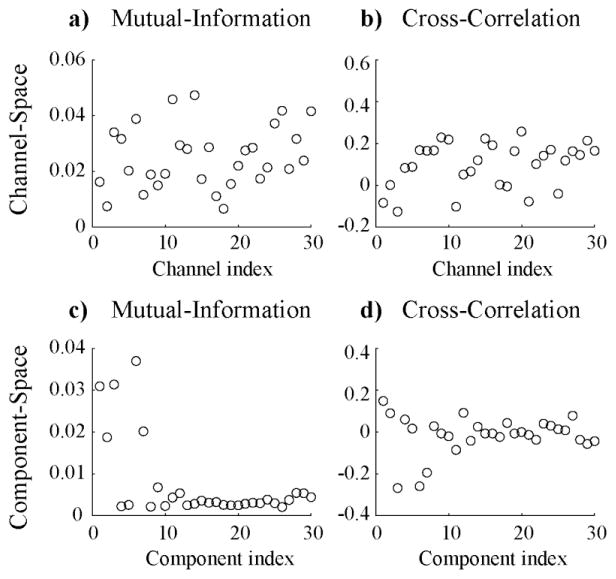
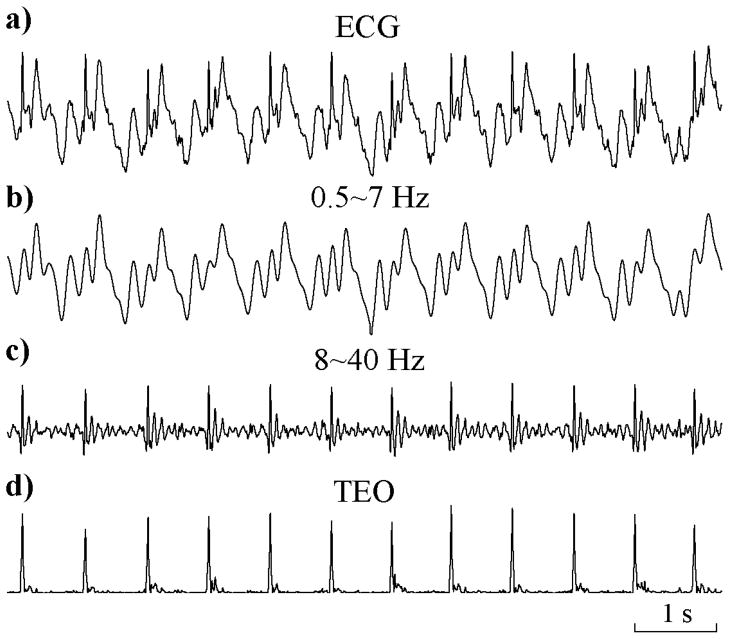
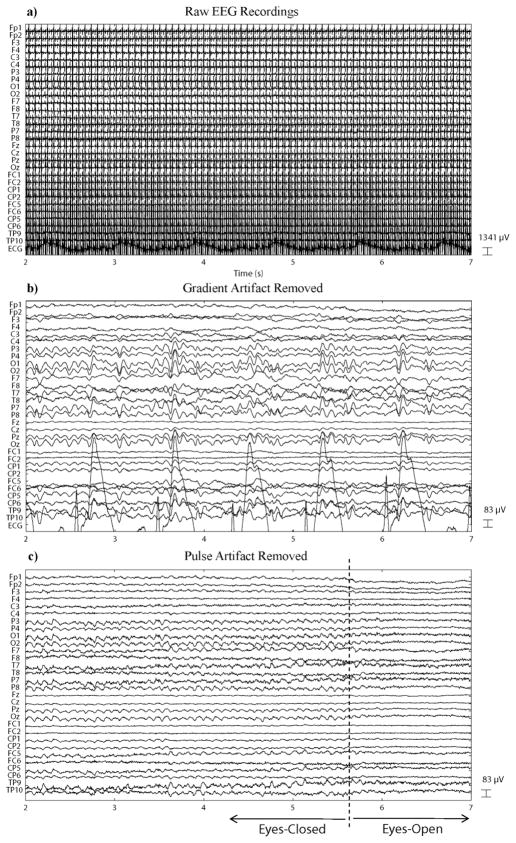
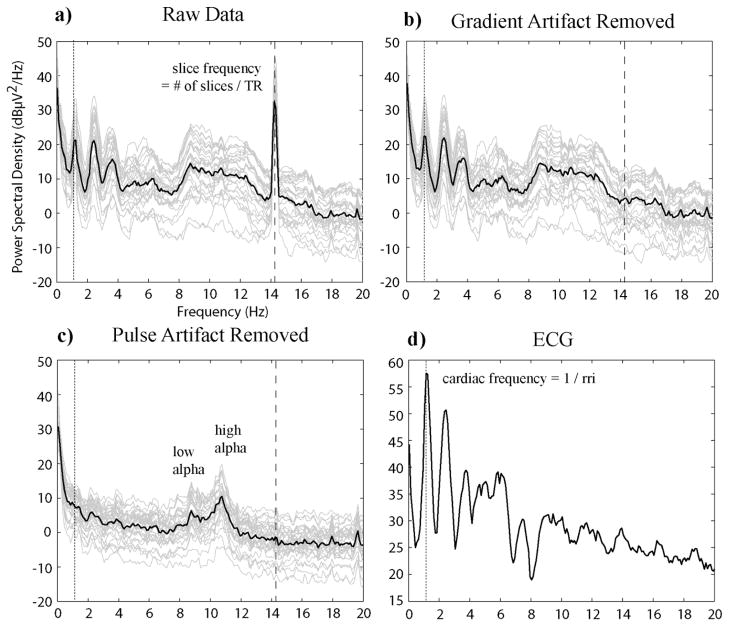
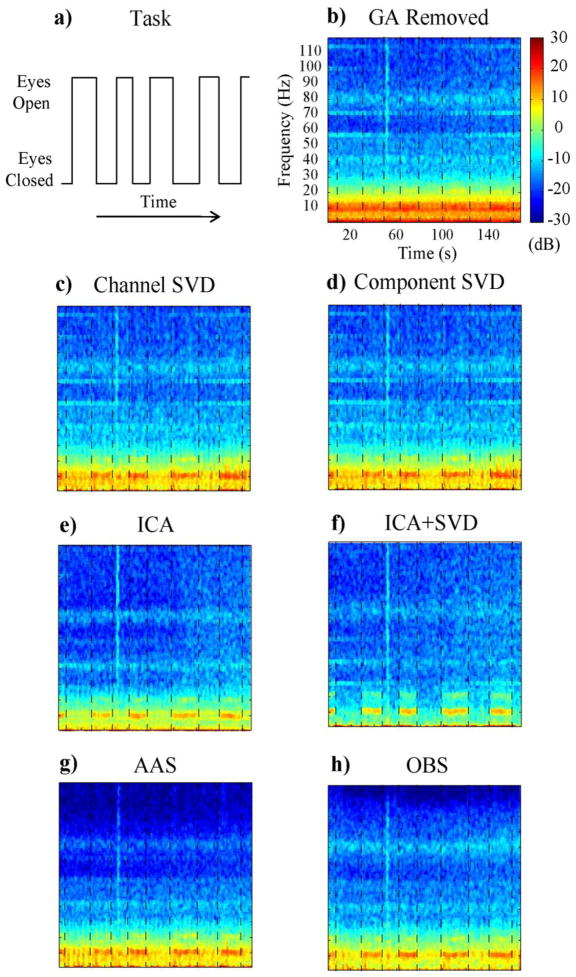
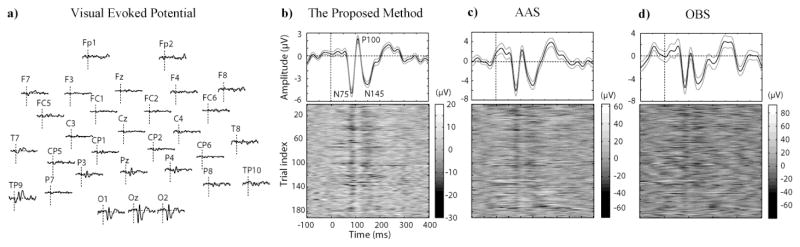
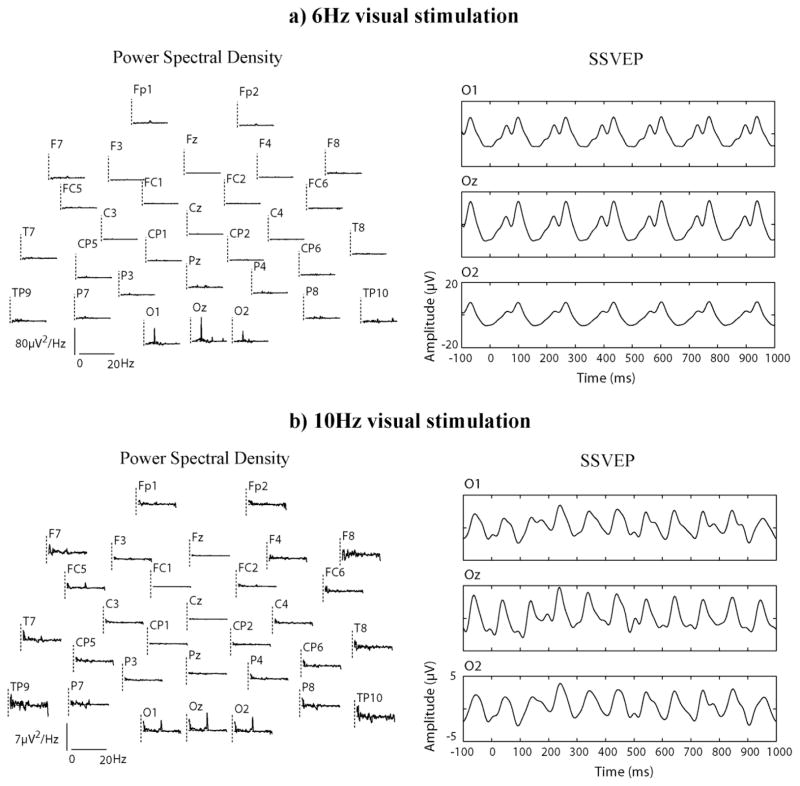
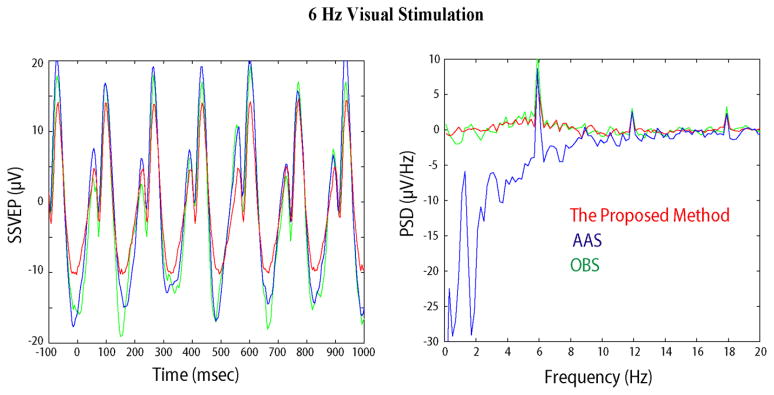
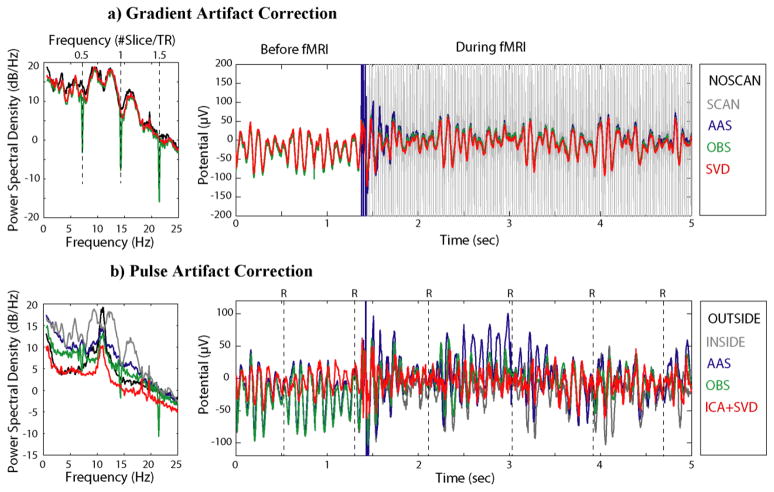
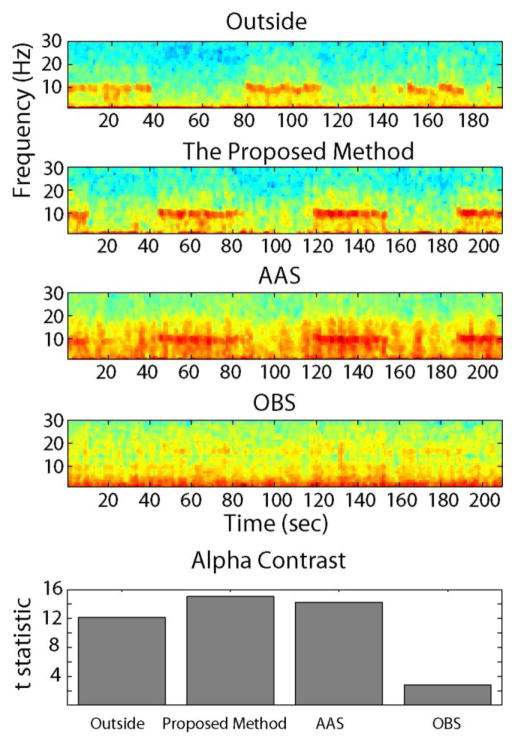
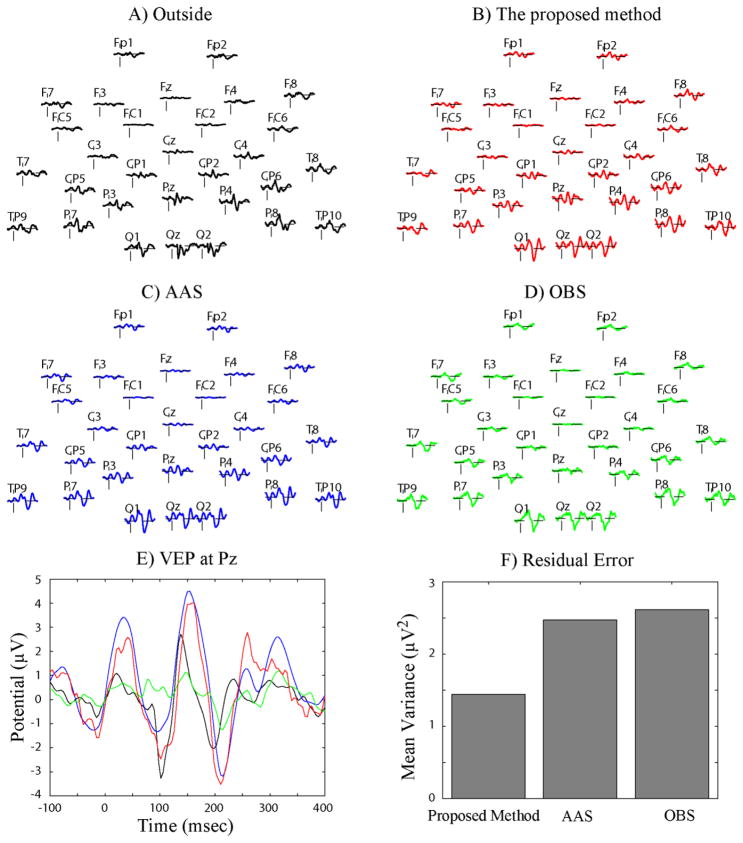
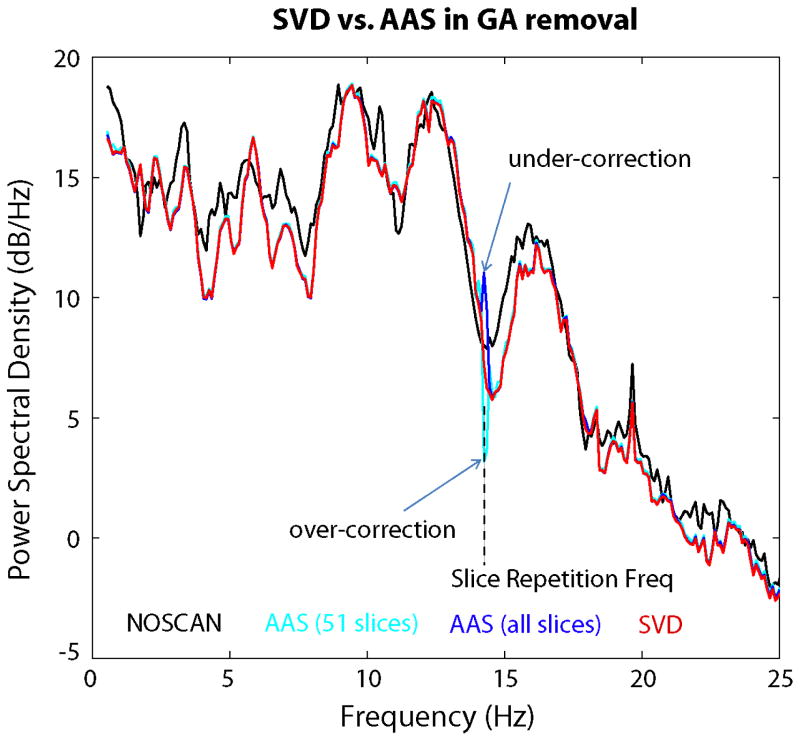
We propose a set of algorithms for sequentially removing artifacts related to MRI gradient switching and cardiac pulsations from electroencephalography (EEG) data recorded during functional magnetic resonance imaging (fMRI). Special emphasis is directed upon the use of statistical metrics and methods for the extraction and selection of features that characterize gradient and pulse artifacts. To remove gradient artifacts, we use channel-wise filtering based on singular value decomposition (SVD). To remove pulse artifacts, we first decompose data into temporally independent components and then select a compact cluster of components that possess sustained high mutual information with the electrocardiogram (ECG). After the removal of these components, the time courses of remaining components are filtered by SVD to remove the temporal patterns phase-locked to the cardiac timing markers derived from the ECG. The filtered component time courses are then inversely transformed into multi-channel EEG time series free of pulse artifacts. Evaluation based on a large set of simultaneous EEG-fMRI data obtained during a variety of behavioral tasks, sensory stimulations and resting conditions showed excellent data quality and robust performance attainable with the proposed methods. These algorithms have been implemented as a Matlab-based toolbox made freely available for public access and research use.


Figures

Figure 1
Figure 1
a) Artifactual SVD component selection for gradient artifact removal is based on raw data recorded from a single channel and triggers sent from the MRI scanner on every slice acquisition. b) Segmented raw data arranged into a matrix and then decomposed into orthogonal components by SVD. The first, second and third SVD components for this example dataset are shown in c), d) and e). In the insets of c), d) and e), the left singular vector is shown in top-left; the right singular vector is shown in bottom-right; the histogram of the right singular vector is shown in bottom-left.
Figure 2
Figure 2
Pulse artifact correction by ICA and SVD filtering. a) Multi-channel EEG signals before (in black) and after (in red) pulse artifact correction. b) Multi-component time series obtained by applying ICA to the signals recorded from all EEG channels. c) Mutual information between every component time course and the ECG. PA-related components are selected from the cluster with high mutual information. d) Multi-component time series after applying SVD filtering to the time course of each component. The filtered time series of all non-PA components (in red) are inversely transformed to the original channel space, resulting in the corrected (red) traces in a).
Figure 3
Figure 3
Mutual information (a, c) or cross correlation (b, d) between channel-wise (a, b) or component-wise (c, d) time-series signals and ECG for an example EEG dataset.
Figure 4
Figure 4
TEO signal generation. a) ECG signal. b) band-pass filtered ECG signal from 0.5 to 7 Hz. c) band-pass filtered ECG signal from 8 to 40 Hz. d) TEO signal obtained by applying TEO to the band-pass filtered ECG displayed in c).
Figure 5
Figure 5
a) Raw time-series data recorded from 30 EEG channels and one ECG channel. b) Signals after removing gradient artifacts. c) Signals after removing both gradient and pulse artifacts. Note the substantially larger scale used in (a).
Figure 6
Figure 6
Power spectral density function profiles for raw data (a), the signals after gradient artifact removal (b), the signals after the removal of both gradient and pulse artifacts (c), and the ECG after gradient artifact removal (d).
Figure 7
Figure 7
EEG responses for a self-paced eyes-closed-eyes-open task, illustrated in (a). Single-channel (Oz) spectrograms are shown for the signal contaminated by pulse artifacts (b), the signal corrected by applying the SVD filtering to the channel-wise (c) or component-wise (d) time series, the signal corrected by removing PA-related ICs (e), the signal corrected by both applying the SVD filtering to component time courses and removing PA-related ICs (f, and). The signals corrected using the AAS (g) and OBS (h) methods are also shown.
Figure 8
Figure 8
a) VEP signals from −100 to 400ms with respect to the stimulus onset. b) Mean and single-trial VEP signals after using the proposed method. On the top is the mean VEP signal at Oz (black) with standard errors computed across trials (grey); on the bottom are the electrical responses to individual stimuli. Panes c) and d) show the VEP signals after using the AAS and OBS methods, respectively.
Figure 9
Figure 9
Power spectral density functions (left) and time courses (right) of the SSVEP signals generated by 6Hz (a) and 10Hz (b) visual stimulation. Spectra are displayed for all EEG channels. Time courses are shown only for three occipital channels (O1, Oz and O2).
Figure 10
Figure 10
Steady-state visual evoked potentials for the Oz electrode for one of the 6 Hz visual stimulation experiment, represented in time (left) and frequency (right) domain, obtained with three different methods: our method (red), AAS (blue) and OBS (green). Note that the data from the method presented here are identical to the Oz-data shown in Fig. 9a.
Figure 11
Figure 11
Comparison between the proposed method and two other existing methods (AAS and OBS) for resting-state EEG. a) Spectra (left) and time courses (right) of the EEG signal at Pz corrected for gradient artifacts with the propose method (red), AAS (blue) and OBS (green) in comparison with the signal recorded without fMRI (black) or with fMRI but without any artifact correction (gray). b) Spectra (left) and time courses (right) of the EEG signal at Pz further corrected for pulse artifact with the proposed method (red), AAS (blue) and OBS (green) in comparison with the signal recorded outside the MRI scanner (black) and the signal before any pulse artifact correction (gray).
Figure 12
Figure 12
Performance of the proposed method and two other existing methods (AAS and OBS) for the alpha power modulation induced by opening and closing eyes, in comparison with the data recorded outside the scanner. The first four rows (from top to bottom) are the alpha power modulation at the Oz channel recorded outside, recorded inside and processed with the proposed method, AAS and OBS. The bottom row is the alpha contrast between eyes-closed and eyes-open periods quantified with two-sample t-test.
Figure 13
Figure 13
Assessment of the proposed method and two other existing methods (AAS and OBS) for quality of VEP signals recorded in the scanner in comparison with those recorded outside the scanner. A) VEP recorded outside the scanner, B) VEP recorded inside the scanner on the same volunteer on the same day, obtained with the proposed method, C) the same data as B) processed with AAS, D) the VEP recorded inside the scanner after processing with OBS, E) VEP at a single channel obtained with different methods, compared to that recorded outside the scanner for the same subject, F) residual errors (difference between the VEP recorded outside and inside the scanner) quantified by the mean variance averaged across channels, resulting from the use of different methods.
Figure 14
Figure 14
Comparison of the EEG spectra for experiments without (black) and with concurrent fMRI acquisition. The latter data were processed using the proposed method (red) and the AAS method with two different moving windows containing 51 (cyan) or all (blue) slice acquisitions.

Similar articles

Cited by

References

    1. Allen PJ, Josephs O, Turner R. A method for removing imaging artifact from continuous EEG recorded during functional MRI. Neuroimage. 2000;12:230–239. - PubMed
    1. Allen PJ, Polizzi G, Krakow K, Fish DR, Lemieux L. Identification of EEG events in the MR scanner: the problem of pulse artifact and a method for its subtraction. Neuroimage. 1998;8:229–239. - PubMed
    1. Anami K, Mori T, Tanaka F, Kawagoe Y, Okamoto J, Yarita M, Ohnishi T, Yumoto M, Matsuda H, Saitoh O. Stepping stone sampling for retrieving artifact-free electroencephalogram during functional magnetic resonance imaging. Neuroimage. 2003;19:281–295. - PubMed
    1. Bell AJ, Sejnowski TJ. An information-maximization approach to blind separation and blind deconvolution. Neural Comput. 1995;7:1129–1159. - PubMed
    1. Benar CG, Aghakhani Y, Wang YH, Izenberg A, Al-Asmi A, Dubeau F, Gotman J. Quality of EEG in simultaneous EEG-fMRI for epilepsy. Clinical Neurophysiology. 2003;114:569–580. - PubMed

Publication types