. 2011 Oct 30;18(11):1290-6.
doi: 10.1038/nsmb.2159.

The mitochondrial transcription and packaging factor Tfam imposes a U-turn on mitochondrial DNA

Affiliations

The mitochondrial transcription and packaging factor Tfam imposes a U-turn on mitochondrial DNA

Huu B Ngo et al. Nat Struct Mol Biol. .

Abstract

Tfam (transcription factor A, mitochondrial), a DNA-binding protein with tandem high-mobility group (HMG)-box domains, has a central role in the expression, maintenance and organization of the mitochondrial genome. It activates transcription from mitochondrial promoters and organizes the mitochondrial genome into nucleoids. Using X-ray crystallography, we show that human Tfam forces promoter DNA to undergo a U-turn, reversing the direction of the DNA helix. Each HMG-box domain wedges into the DNA minor groove to generate two kinks on one face of the DNA. On the opposite face, a positively charged α-helix serves as a platform to facilitate DNA bending. The structural principles underlying DNA bending converge with those of the unrelated HU family proteins, which have analogous architectural roles in organizing bacterial nucleoids. The functional importance of this extreme DNA bending is promoter specific and seems to be related to the orientation of Tfam on the promoters.


Figures

Figure 1
Figure 1. Overview of the Tfam–mtDNA complex
(a) The domain structure of mature Tfam. Residues 1–42 constitute the mitochondrial targeting sequence that is cleaved upon import of Tfam into the mitochondrial matrix. (b) Organization of the LSP and HSP1 promoters. The two Tfam binding sites are oriented in opposite directions relative to the direction of transcription, based on comparative sequence analysis, . The sequence of the LSP DNA fragment used for crystallization is indicated. (c) Side view of the Tfam–mtDNA complex. The Tfam domains are color coded as in panel a, and DNA is colored in gray. The LSP transcriptional start site would be located away from the DNA end on the left, as indicated by the arrow. Note that HMG-box B binds to the half-site further away from the transcriptional start site. (d) A view of the Tfam–mtDNA complex from the top. The protein and DNA are color coded as in panel c. (e) Electrostatic surface potential plot of Tfam. Surface areas of Tfam that are buried upon DNA binding are highlighted in yellow mesh. The HMG-box A, linker, HMG-box B, and C-tail regions are labeled. (f) Electrostatic surface potential plot of Tfam, viewed in the same orientation as in panel d and flipped 180° from panel e. This view emphasizes that the surface of the linker contacts the DNA.
Figure 2
Figure 2. Molecular mass of the Tfam–mtDNA complex determined by SEC-MALS
Elution profiles of Tfam, the Tfam–mtDNA complex, and BSA (control) examined by SEC-MALS. The horizontal red, blue, and black lines correspond to SEC-MALS calculated masses for Tfam, Tfam–mtDNA, and BSA, respectively. The corresponding theoretical masses are 28,075 Da (Tfam), 45,410 Da (Tfam–mtDNA; 1:1 complex), and 66,776 Da (BSA).
Figure 3
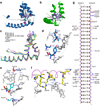
Figure 3. Interactions of Tfam with DNA
(a) A ribbon diagram of HMG-box A. Hydrophobic residues that stabilize the core are highlighted, with the 2Fo-Fc electron density map contoured at 1.5 σ. (b) HMG-box B, highlighted as in panel a. (c) Superimposition of HMG-boxes A and B of Tfam with other HMG-boxes. Structures correspond to the following accession numbers, and RMSD values, relative to HMG-box A of Tfam, are provided in parentheses: HMG-box B of Tfam without DNA, 3fgh (0.974); Hmgb1 box A, 1ckt (1.101); Lef1, 2lef (1.162); Sox2, 1gt0 (1.152); Hmgd, 1qrv (1.127). (d) Interactions of HMG-box A with DNA (gray). Tyr57, Leu58, Ser61, and Ile81 make contacts with the DNA bases and sugar phosphate backbone, as indicated by dotted lines with distances (in angstroms). Thr77 contacts a deoxyribose in the DNA backbone, and a mutant containing alanine at this position shows reduced DNA bending (Table 2). (e) Interactions of HMG-box B with DNA (gray). Arg157, Asn163, Gln179, and Pro178 make contacts with the bases, as indicated by the dotted lines. Tyr162 contacts a deoxyribose in the DNA backbone, and the Y162A mutant shows reduced DNA bending (Table 2). (f) Interactions of the α-helical linker with DNA (gray). The backbone of the linker helix is traced in magenta. (g) Interactions between Tfam and DNA, analyzed by NUCPLOT. Blue and red dashed lines represent hydrogen bonded and nonbonded contacts (< 3.35Å) to DNA, respectively. Circles labeled W indicate water-mediated interaction with DNA. Stereo views of panels a, b, d, and e are provided in Supplementary Figure 2.
Figure 4
Figure 4. Comparison of Tfam and Hbb structures
(a) Profiles of minor grove width in the Tfam–mtDNA (blue) and Hbb–DNA (red) structures. (b) Roll angle profiles in the Tfam–mtDNA (blue) and Hbb–DNA (red) structures. (c) Twist angle profiles in the Tfam–mtDNA (blue) and Hbb–DNA (red) structures. (d) Side view of the Tfam–mtDNA complex. The protein is shown in green, and DNA is shown in blue. (e) Side view of the Hbb–DNA complex. Hbb is shown in light blue, and DNA is shown in red. (f) Manual overlay of DNA in the Tfam–mtDNA and Hbb–DNA structures. DNAs from the two structures are color coded as in panels d and e. Analyses of the helical parameters of the DNA molecules were carried out using 3DNA.
Figure 5
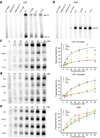
Figure 5. Tfam mutants with a selective defect at LSP
(a) in vitro transcription reactions using an LSP template. Reactions contained 100 nM Tfam or the indicated mutant. HMG-box A: residues 43–122; HMG-box B: residues 153–222; no tail: residues 43–222; L6: K136A H137A K139A R140A K146A K147A. The LSP template generates a 420 nt full-length (run-off) transcript and a truncated 120 nt transcript. (b) Same as panel a, except using an HSP1 template. (c) Generation of full-length LSP transcripts by Tfam and mutants. The left panel shows representative reactions, using the indicated concentrations of protein. Quantification is presented in the right panel, with error bars representing standard deviations from three independent experiments. (d) same as in panel c, except that truncated LSP transcripts are shown and quantified. A fraction of LSP transcripts are known to terminate prematurely at the conserved sequence block II (CSBII) site located downstream of the start site. (e) same as in panel c, except that an HSP1 template was used.
Figure 6
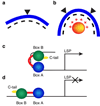
Figure 6. Models for DNA bending and transcriptional activation
(a) DNA bending by a single HMG-box. The DNA (blue) is moderately bent by wedging of the HMG-box (triangle) on one face of the DNA. Dashes indicate negative charges on the opposite face of the DNA backbone. (b) Extreme DNA bending by Tfam and HU family proteins. Two wedges (triangles) applied to one face of DNA result in two acute kinks. A positively charged platform (circle) on the opposite face helps to neutralize the negative charges of the DNA backbone. (c) Transcriptional activation at LSP. Based on our crystal structure, HMG-box B binds the half-site further away from the transcriptional start site. The C-terminal tail nevertheless faces the transcriptional start site because of the extreme DNA bend. (d) With Tfam mutants, we suggest that the defect in DNA bending prevents proper orientation of the C-terminal tail.

Comment in

  • TFAM forces mtDNA to make a U-turn.
    Hallberg BM, Larsson NG. Hallberg BM, et al. Nat Struct Mol Biol. 2011 Nov 4;18(11):1179-81. doi: 10.1038/nsmb.2167. Nat Struct Mol Biol. 2011. PMID: 22056802 No abstract available.

References

Main References

    1. Falkenberg M, Larsson NG, Gustafsson CM. DNA replication and transcription in mammalian mitochondria. Annu Rev Biochem. 2007;76:679–699. - PubMed
    1. Bonawitz ND, Clayton DA, Shadel GS. Initiation and beyond: multiple functions of the human mitochondrial transcription machinery. Mol Cell. 2006;24:813–825. - PubMed
    1. Fisher RP, Clayton DA. Purification and characterization of human mitochondrial transcription factor 1. Mol Cell Biol. 1988;8:3496–3509. - PMC - PubMed
    1. Fisher RP, Topper JN, Clayton DA. Promoter selection in human mitochondria involves binding of a transcription factor to orientation-independent upstream regulatory elements. Cell. 1987;50:247–258. - PubMed
    1. Larsson NG, et al. Mitochondrial transcription factor A is necessary for mtDNA maintenance and embryogenesis in mice. Nat Genet. 1998;18:231–236. - PubMed

Methods-only references

    1. Van Duyne GD, Standaert RF, Karplus PA, Schreiber SL, Clardy J. Atomic structures of the human immunophilin FKBP-12 complexes with FK506 and rapamycin. J Mol Biol. 1993;229:105–124. - PubMed
    1. Leslie AGW. Joint CCP4 and ESF-EACBM Newsletter on Protein Crystallography. Warrington WA4 4AD, UK: 1992.
    1. Kabsch W. XDS. Acta Cryst. 2010;D66:125–132. - PMC - PubMed
    1. Evans PR. In: Proceedings of the CCP4 Study Weekend. Data Collection and Processing. Sawyer L, Isaacs N, Bailey S, editors. Warrington: Daresbury Laboratory; 1993. pp. 114–122.
    1. Collaborative Computational Project, N. The CCP4 Suite: Programs for Protein Crystallography. Acta Cryst. 1994;D50:760–763. - PubMed

Publication types

MeSH terms

Associated data