. 2011 Oct 30;480(7375):123-7.
doi: 10.1038/nature10579.

Control of Drosophila endocycles by E2F and CRL4(CDT2)

Affiliations

Control of Drosophila endocycles by E2F and CRL4(CDT2)

Norman Zielke et al. Nature. .

Abstract

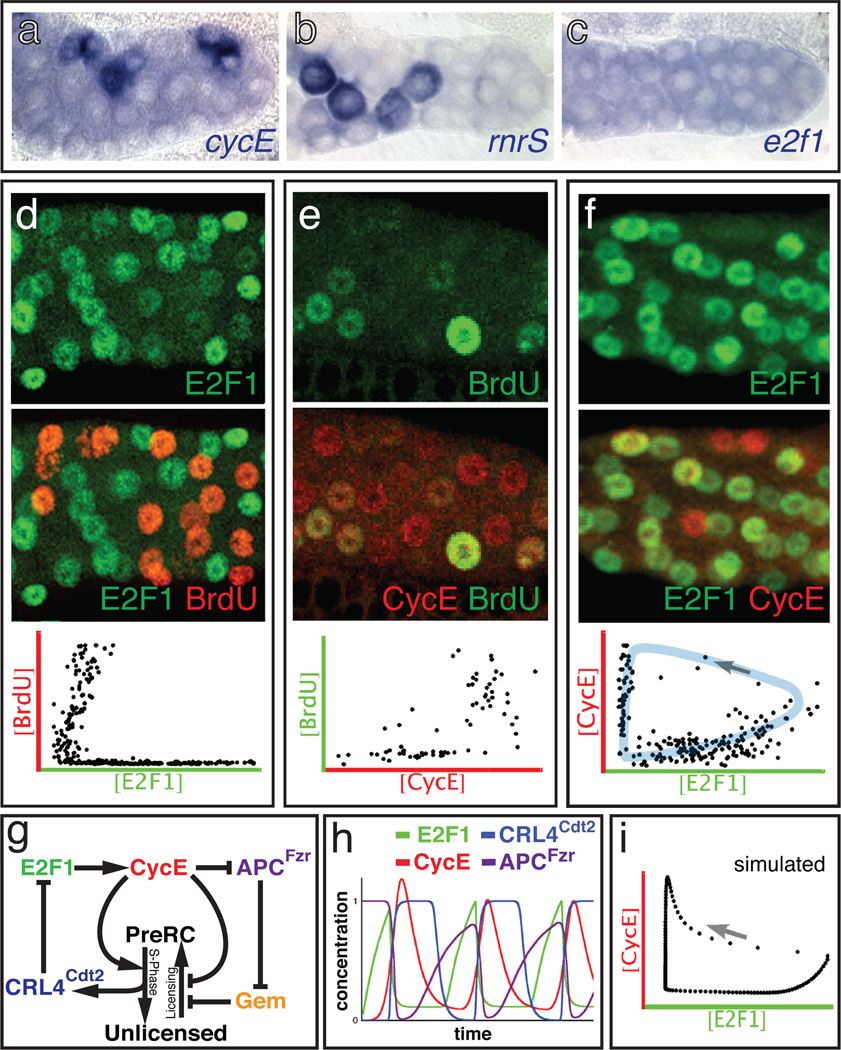
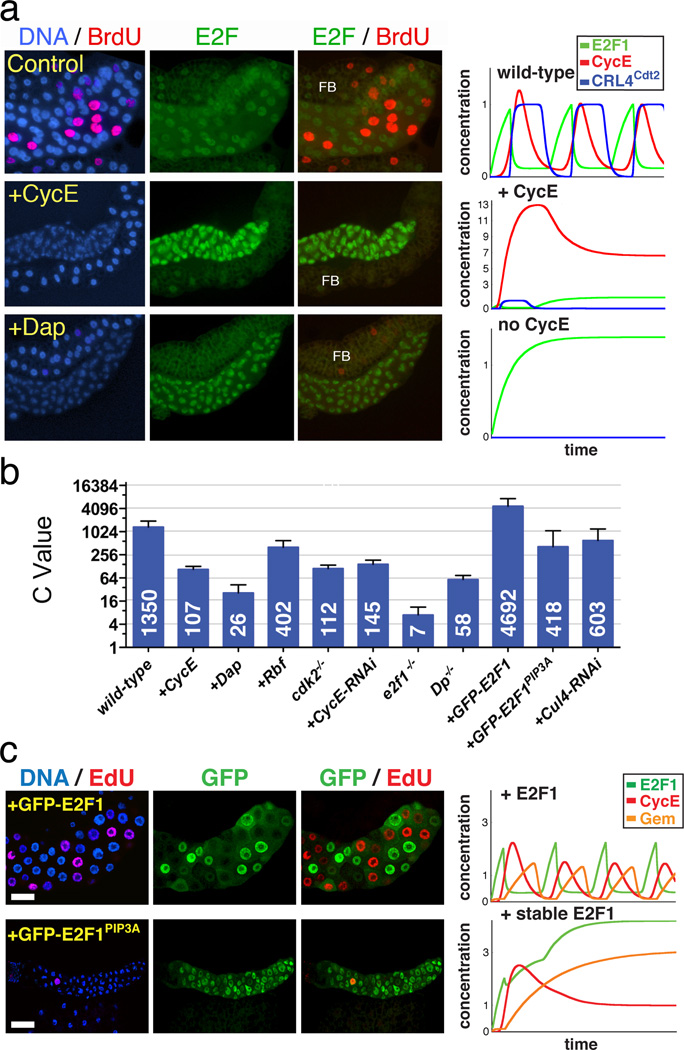
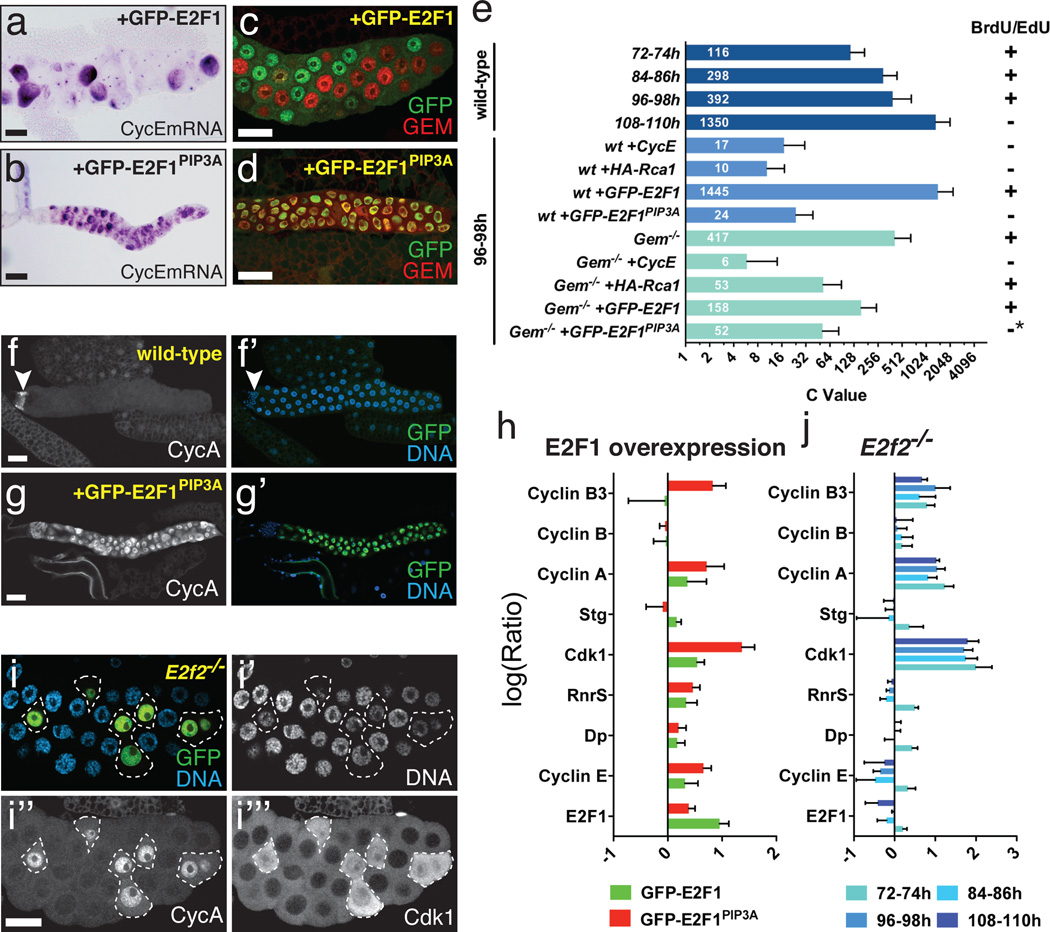
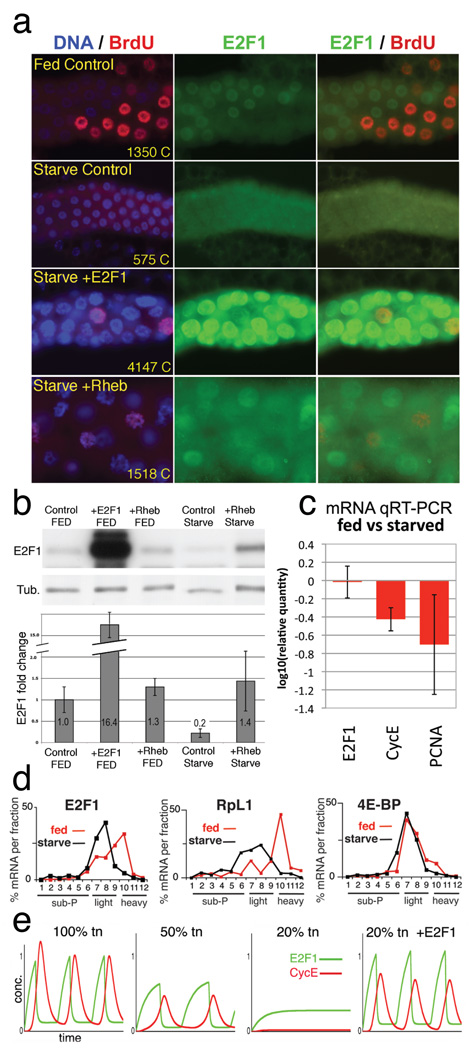
Endocycles are variant cell cycles comprised of DNA synthesis (S)- and gap (G)-phases but lacking mitosis. Such cycles facilitate post-mitotic growth in many invertebrate and plant cells, and are so ubiquitous that they may account for up to half the world's biomass. DNA replication in endocycling Drosophila cells is triggered by cyclin E/cyclin dependent kinase 2 (CYCE/CDK2), but this kinase must be inactivated during each G-phase to allow the assembly of pre-Replication Complexes (preRCs) for the next S-phase. How CYCE/CDK2 is periodically silenced to allow re-replication has not been established. Here, using genetic tests in parallel with computational modelling, we show that the endocycles of Drosophila are driven by a molecular oscillator in which the E2F1 transcription factor promotes CycE expression and S-phase initiation, S-phase then activates the CRL4(CDT2) ubiquitin ligase, and this in turn mediates the destruction of E2F1 (ref. 7). We propose that it is the transient loss of E2F1 during S phases that creates the window of low Cdk activity required for preRC formation. In support of this model overexpressed E2F1 accelerated endocycling, whereas a stabilized variant of E2F1 blocked endocycling by deregulating target genes, including CycE, as well as Cdk1 and mitotic cyclins. Moreover, we find that altering cell growth by changing nutrition or target of rapamycin (TOR) signalling impacts E2F1 translation, thereby making endocycle progression growth-dependent. Many of the regulatory interactions essential to this novel cell cycle oscillator are conserved in animals and plants, indicating that elements of this mechanism act in most growth-dependent cell cycles.


Figures

Figure 1
Figure 1. Wildtype salivary gland endocycles
a-c) In situ hybridization of WT 72h AED glands to the indicated mRNAs. d-f) WT salivary glands at 72h AED double-labeled for: d) E2F1 (green) and BrdU (red); e) CycE (red) and BrdU (green); f) CycE (red) and E2F1 (green). Graphs show nuclear concentrations measured from micrographs of 2–3 glands, in which each dot represents one nucleus. Shaded region (blue) shows trajectory of E2F1/CycE oscillations with an arrow indicating the expected temporal progression. g) Simplified schematic of the computational model. See Fig S4. h) Time plot for WT predicted by the model. i) Nuclear concentrations predicted by the model; arrow represents temporal progression.
Figure 2
Figure 2. Genetic tests of the endocycle mechanism
a) Salivary glands (centered) and associated fat body (above or below; FB) from 72h AED larvae expressing the indicated genes under ptc-Gal4/UAS control. ptc-Gal4 expresses in salivary glands but not in fat body. Left column shows DNA (blue) and BrdU (red) incorporated from 71–72h AED. Middle column shows E2F1 (green). Right column shows E2F1 and BrdU. All images had identical exposures and magnifications. Graphs (right) show simulated time plots of E2F1 (green) CycE (red) protein levels and CRL4Cdt2 (Cul4-E3) activity (blue) for each genotype. See Table S1 for parameters. b) Nuclear DNA values from 96h AED glands. For each genotype about 40 nuclei from 6–20 salivary glands were analyzed. Error bars represent standard deviations. ptc-Gal4 drove expression of the UAS-linked transgenes indicated with a “+”. Dp −/− : Dpa2/Df(2R)Exel7124 mutant. E2f1−/− : E2f17172 mutant cells generated by mitotic recombination. cdk2−/− mutant glands were generated as described in methods. c) Salivary glands expressing wild-type GFP-E2F1 (above) or GFP-E2F1PIP3A (below). Layout as in a.
Figure 3
Figure 3. Endocycle arrest by stabilized E2F1
a-d) Expression of WT GFP-E2F1 with ptc-Gal4 promoted endocycling with cyclic cycE (a) and Gem (c), whereas GFP-E2FPIP3A caused endocycle arrest with uniform cycE (b) and Gem (d) expression. e) C-values per nucleus for the indicated genotypes and timepoints. For each genotype about 40 nuclei from 10–20 salivary glands were analyzed. Error bars represent standard deviations. f-g) CycA expression in WT (f) and glands expressing WT GFP-E2F1 (f) or GFP-E2FPIP3A (g). Arrowhead (f) indicates diploid imaginal ring cells. h) qRT-PCR measurements of the indicated mRNAs, from 72h AED salivary glands expressing GFP-E2F1 (green) or GFP-E2F1PIP3A (red). i) CycA and Cdk1 accumulation in E2f2 mutant cells, generated by MARCM mitotic recombination. GFP in i marks mutant cells (outlined). Cdk1 in i’’’ was detected using anti-PSTAIRE antibody. j) qRT-PCR measurements of the indicated mRNAs, from E2f2 mutant glands at the indicated timepoints. Log10(Ratio)s for h and j are relative to WT controls. Error bars represent standard deviations derived from 3–4 biological replicates.
Figure 4
Figure 4. E2F1 is a growth sensor
a) Salivary glands labeled for DNA (blue), E2F1 (green), and incorporated BrdU (red). Fed Control (WT) was labeled with BrdU at 48h and fixed at 49h. Starved” animals were transferred to protein-free media at 48h AED, labeled with BrdU at 96h, and fixed at 97h AED. ptc-Gal4 drove expression of UAS-E2F1/DP or UAS-Rheb in the lower two panels. Chromatin (C) values are average nuclear DNA values from 10 glands measured at 120h AED. b) Immunoblot of salivary glands as in a, with quantitation, normalized to tubulin, below. c) mRNA levels from starved and fed control glands, measured by qRT-PCR. d) mRNA levels from 3d protein-starved (black) or fed control (red) whole larvae, quantified from polysome gradient fractions by qRT-PCR. X axis indicates gradient fraction number. e) Computational simulation of starvation by reducing total protein synthesis (tn). In the “20% tn +E2F1” graph, translation of E2F1 was 100% of normal but translation of all other proteins was reduced to 20%. Graphed values (b, c) include standard deviations calculated from 3 independent biological samples.

Comment in

References

    1. Edgar BA, Orr-Weaver TL. Endoreplication cell cycles: more for less. Cell. 2001;105:297–306. - PubMed
    1. Lilly MA, Duronio RJ. New insights into cell cycle control from the Drosophila endocycle. Oncogene. 2005;24:2765–2775. - PubMed
    1. Sugimoto-Shirasu K, Roberts K. "Big it up": endoreduplication and cell-size control in plants. Curr Opin Plant Biol. 2003;6:544–553. - PubMed
    1. Whitman WB, Coleman DC, Wiebe WJ. Prokaryotes: the unseen majority. Proc Natl Acad Sci U S A. 1998;95:6578–6583. - PMC - PubMed
    1. Follette PJ, Duronio RJ, O'Farrell PH. Fluctuations in cyclin E levels are required for multiple rounds of endocycle S phase in Drosophila. Current Biology. 1998;8:235–238. - PMC - PubMed

Publication types

MeSH terms

Substances