. 2011 Oct 30;480(7376):254-8.
doi: 10.1038/nature10575.

Mapping intact protein isoforms in discovery mode using top-down proteomics

Affiliations

Mapping intact protein isoforms in discovery mode using top-down proteomics

John C Tran et al. Nature. .

Abstract

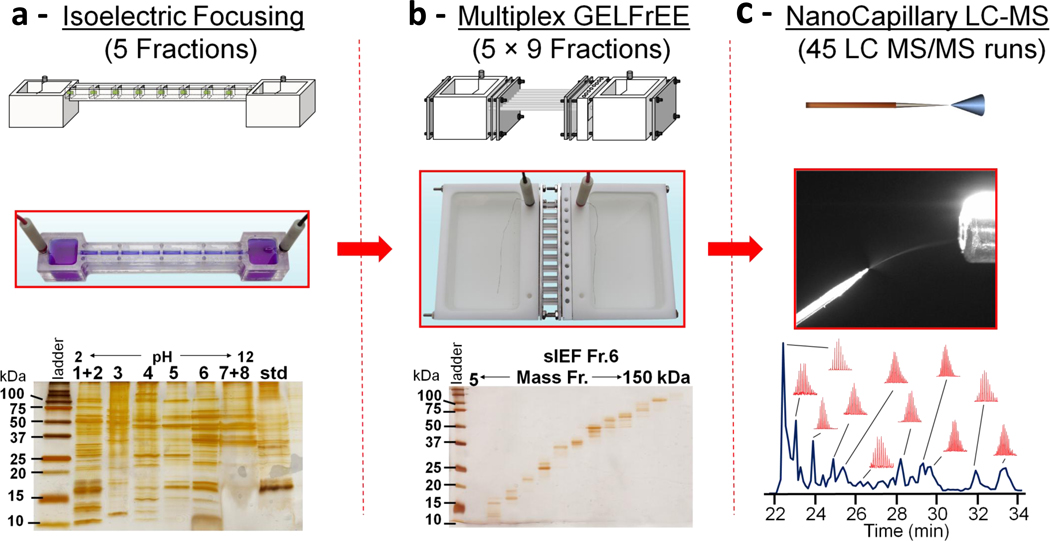
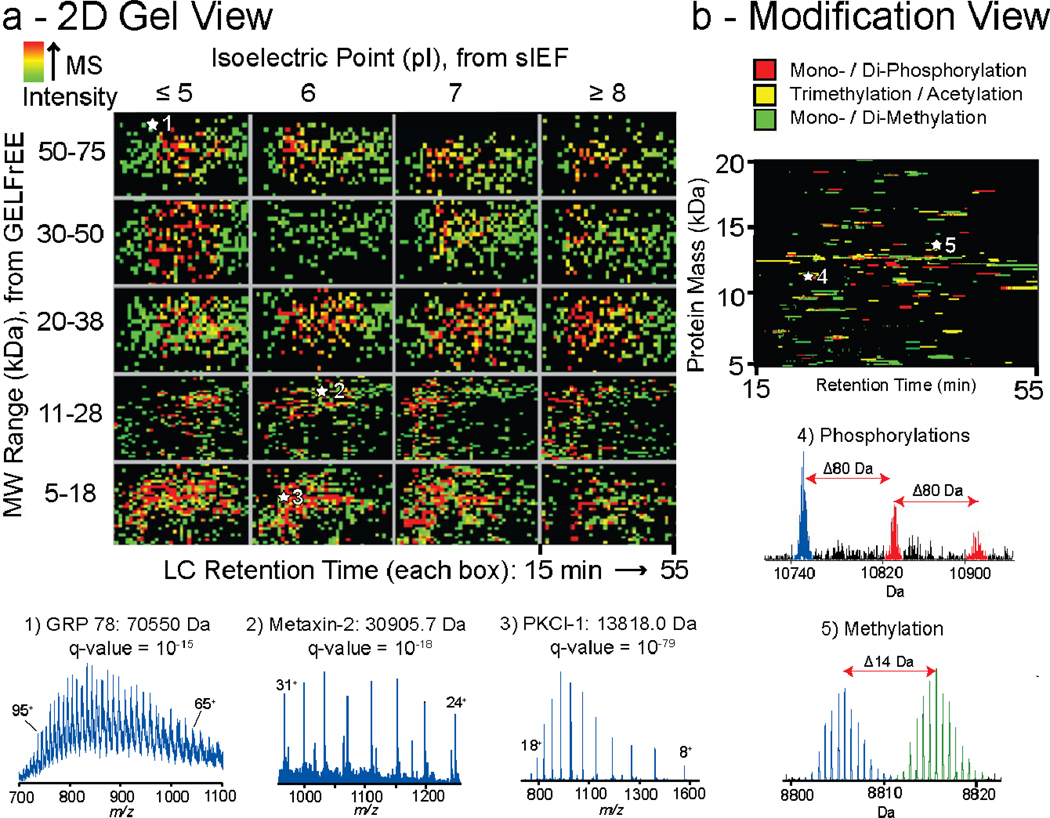
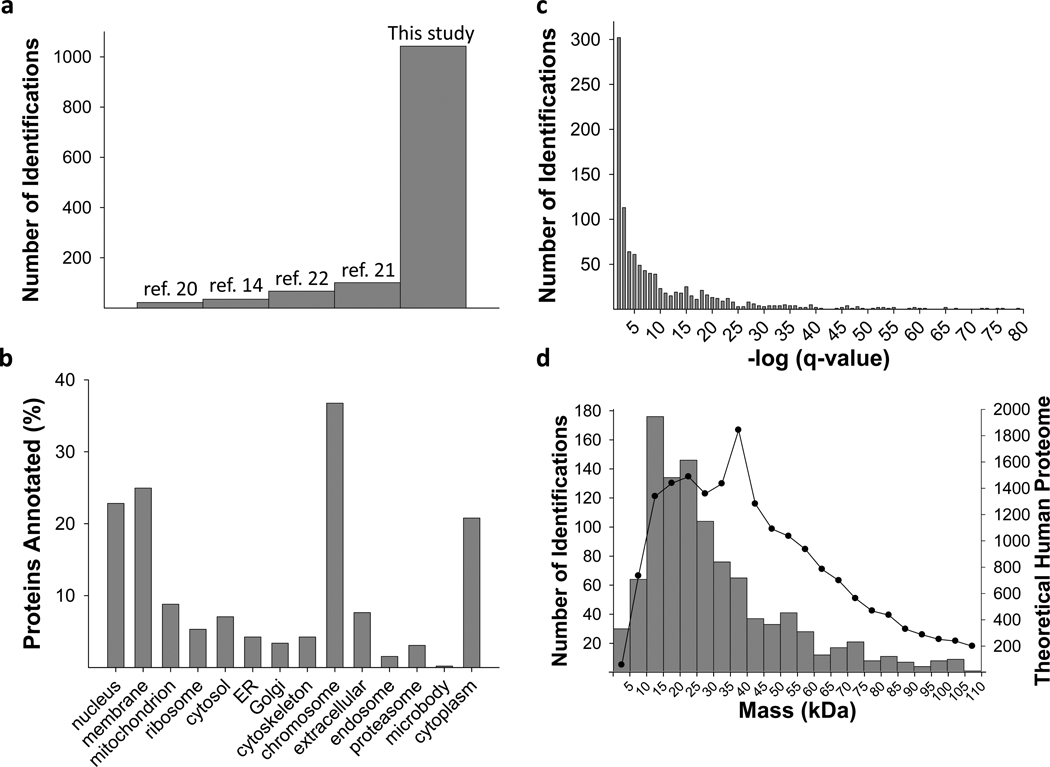
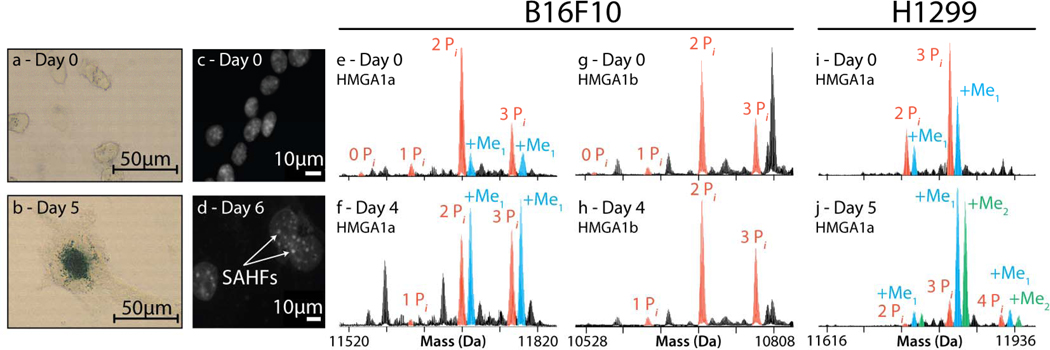
A full description of the human proteome relies on the challenging task of detecting mature and changing forms of protein molecules in the body. Large-scale proteome analysis has routinely involved digesting intact proteins followed by inferred protein identification using mass spectrometry. This 'bottom-up' process affords a high number of identifications (not always unique to a single gene). However, complications arise from incomplete or ambiguous characterization of alternative splice forms, diverse modifications (for example, acetylation and methylation) and endogenous protein cleavages, especially when combinations of these create complex patterns of intact protein isoforms and species. 'Top-down' interrogation of whole proteins can overcome these problems for individual proteins, but has not been achieved on a proteome scale owing to the lack of intact protein fractionation methods that are well integrated with tandem mass spectrometry. Here we show, using a new four-dimensional separation system, identification of 1,043 gene products from human cells that are dispersed into more than 3,000 protein species created by post-translational modification (PTM), RNA splicing and proteolysis. The overall system produced greater than 20-fold increases in both separation power and proteome coverage, enabling the identification of proteins up to 105 kDa and those with up to 11 transmembrane helices. Many previously undetected isoforms of endogenous human proteins were mapped, including changes in multiply modified species in response to accelerated cellular ageing (senescence) induced by DNA damage. Integrated with the latest version of the Swiss-Prot database, the data provide precise correlations to individual genes and proof-of-concept for large-scale interrogation of whole protein molecules. The technology promises to improve the link between proteomics data and complex phenotypes in basic biology and disease research.


Figures

Figure 1
Figure 1
Schematic of the four dimensional (4D) platform for high resolution fractionation of protein molecules. Schematics (top) and photographs (middle) are shown for (a) a custom device for solution isoelectric focusing (sIEF), (b) a custom device for multiplexed gel eluted liquid fraction entrapment electrophoresis (mGELFrEE), and (c) reversed phase chromatography (RPLC) coupled t o M S. Representative 1D gels of fractions collected from the two electrophoretic devices are shown below their pictures; note the resolution attainable at the level of intact proteins. The combined resolution of RPLC with Fourier-Transform Mass Spectrometry (FTMS) is depicted by the chromatogram along with selected isotopic distributions for protein ions measured during the run.
Figure 2
Figure 2
Two visual representations of proteome-scale runs. (a) The heat map is generated from combined 4D runs of nuclear and cytosolic extracts. Intact mass and pI values are indicated on the y-axis and x-axis respectively. Each box in the grid displays total ion chromatograms from LC runs of 2D-LE fractions plotted as time vs. neutral intact mass. The MS intensity is indicated by color (legend on top left). Representative precursor scans were extracted from the heat map for ESI-MS spectra of high (1), medium (2), and low (3) mass proteins, along with their identifications from online fragmentation (insets at bottom). (b) Plot created from selective display of protein pairs with mass differences consistent with acetylation (yellow), phosphorylation (red), and methylation (green), with three and two protein species shown as examples in insets (4) and (5), respectively.
Figure 3
Figure 3
Proteome analysis metrics associated with this study. (a) Graph showing the striking increase in identifications from previous studies achieved in archaeal, bacterial, yeast or human systems. (b) A gene ontology analysis for the identifications in this study. (c) Histogram showing the distribution of q-values for the identified proteins. (d) Plot showing the molecular weight distribution for the unique identifications obtained. The line graph depicts the theoretical molecular weight distribution for the human proteome (Swiss-Prot, Homo sapiens, 20223 entries).
Figure 4
Figure 4
Monitoring dynamics of HMGA1 isoforms during senescence in B16F10 and H1299 cells. After induction of DNA damage by transient treatment with camptothecin for H1299 cells or etoposide for B16F10, progression of accelerated senescence was monitored by SA-β-Gal (a–b) or DAPI staining (c-d) over the specified recovery period. Changes in modification profiles on HMGA1a (e–f) and HMGA1b (g–h) from B16F10 showed mild increases in phosphorylation occupancy but a significant increase in methylation levels on multiply-phosphorylated species. A more striking increase in both methylation and phosphorylation was observed in senescent H1299 cells (i–j). No such methylations were observed in the HMGA1b profiles for either cell line.

Comment in

  • Wholesome proteomics.
    Krasteva PV. Krasteva PV. Nat Methods. 2011 Dec;8(12):1002. doi: 10.1038/nmeth.1788. Nat Methods. 2011. PMID: 22238779 No abstract available.

References

    1. Wisniewski JR, Zougman A, Nagaraj N, Mann M. Universal sample preparation method for proteome analysis. Nat. Methods. 2009;6:359–362. - PubMed
    1. Nesvizhskii AI, Aebersold R. Interpretation of shotgun proteomic data: the protein inference problem. Mol. Cell. Proteomics. 2005;4:1419–1440. - PubMed
    1. Schluter H, Apweiler R, Holzhutter HG, Jungblut PR. Finding one's way in proteomics: a protein species nomenclature. Chem. Cent. J. 2009;3(11) - PMC - PubMed
    1. Boyne MT, Pesavento JJ, Mizzen CA, Kelleher NL. Precise characterization of human histories in the H2A gene family by top down mass spectrometry. J. Proteome Res. 2006;5:248–253. - PubMed
    1. Ge Y, Rybakova IN, Xu QG, Moss RL. Top-down high-resolution mass spectrometry of cardiac myosin binding protein C revealed that truncation alters protein phosphorylation state. Proc. Natl. Acad. Sci. U.S.A. 2009;106:12658–12663. - PMC - PubMed

Publication types