. 2011 Oct 30;29(11):1039-45.
doi: 10.1038/nbt.2017.

Comprehensive assay of kinase catalytic activity reveals features of kinase inhibitor selectivity

Affiliations

Comprehensive assay of kinase catalytic activity reveals features of kinase inhibitor selectivity

Theonie Anastassiadis et al. Nat Biotechnol. .

Abstract

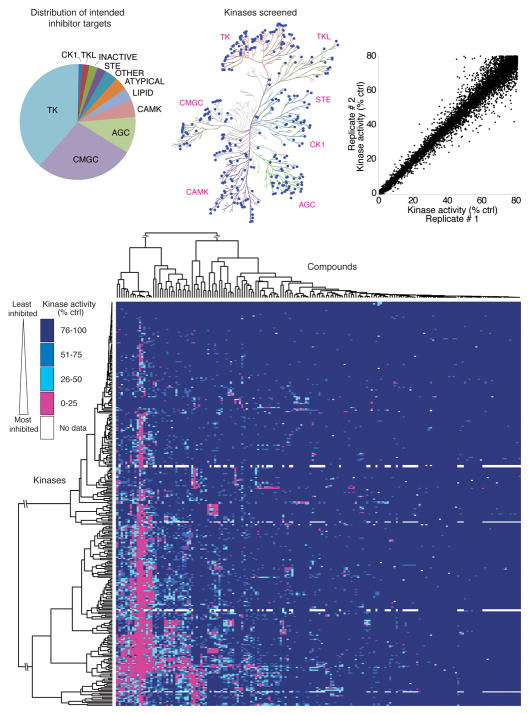
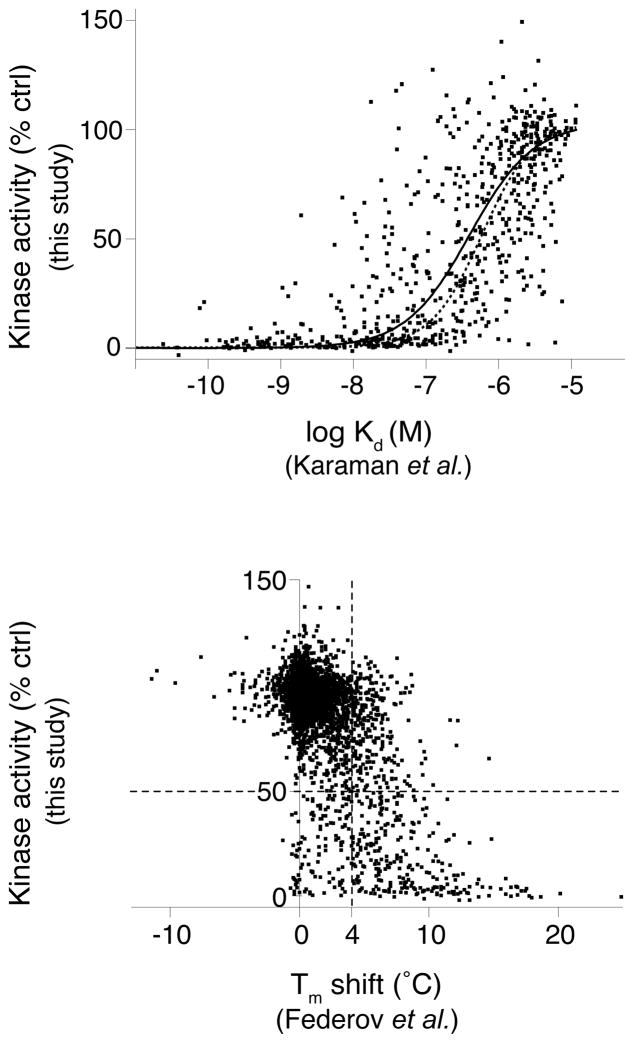
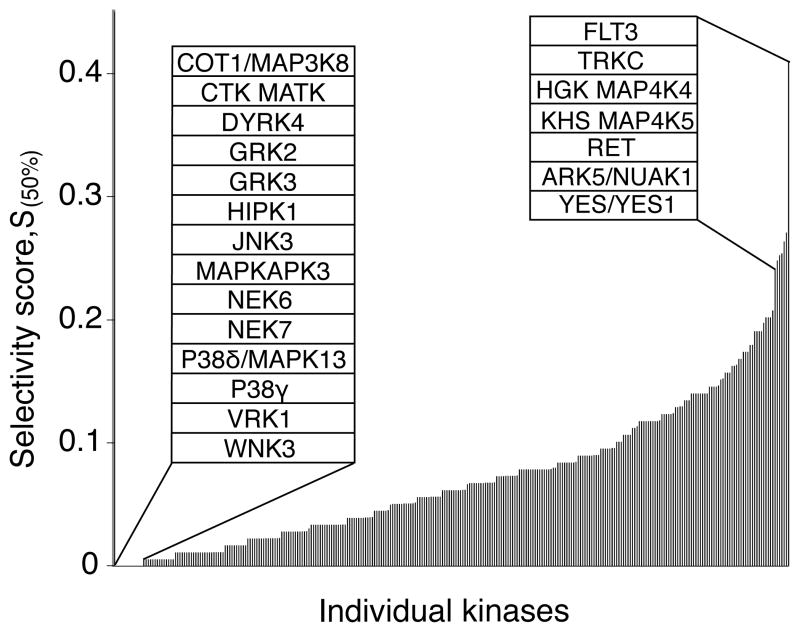
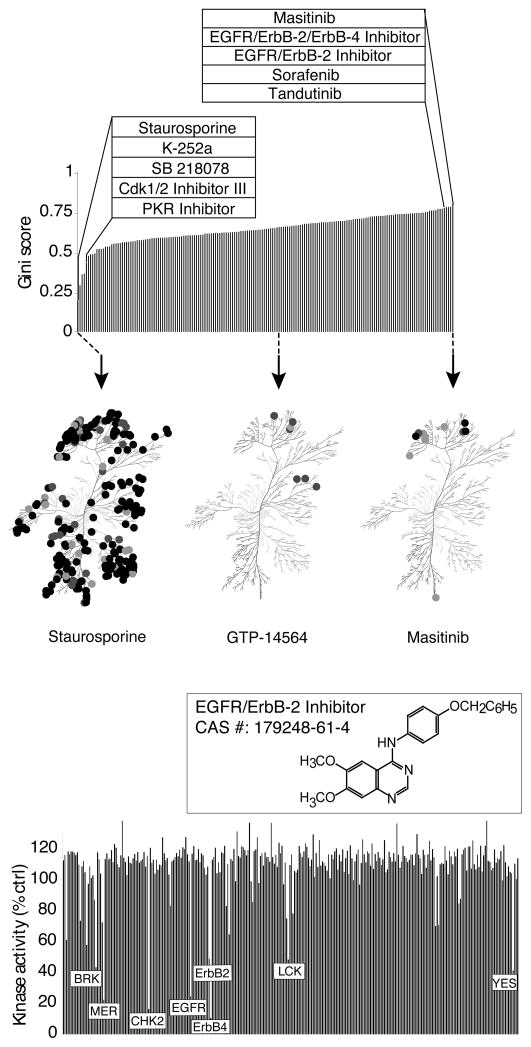
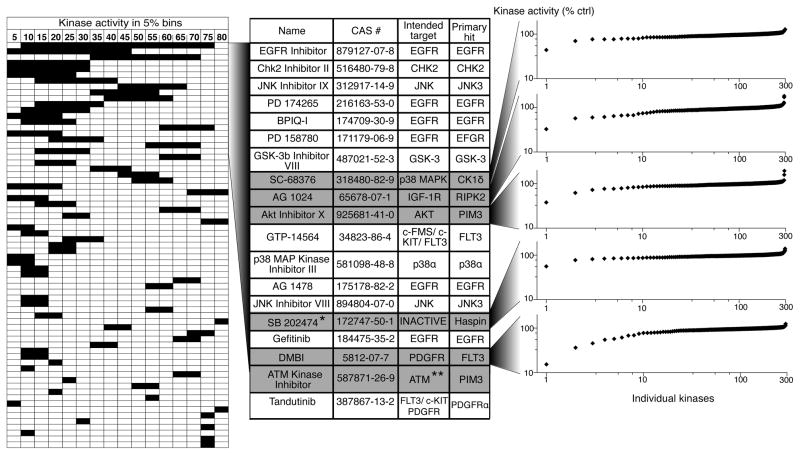
Small-molecule protein kinase inhibitors are widely used to elucidate cellular signaling pathways and are promising therapeutic agents. Owing to evolutionary conservation of the ATP-binding site, most kinase inhibitors that target this site promiscuously inhibit multiple kinases. Interpretation of experiments that use these compounds is confounded by a lack of data on the comprehensive kinase selectivity of most inhibitors. Here we used functional assays to profile the activity of 178 commercially available kinase inhibitors against a panel of 300 recombinant protein kinases. Quantitative analysis revealed complex and often unexpected interactions between protein kinases and kinase inhibitors, with a wide spectrum of promiscuity. Many off-target interactions occur with seemingly unrelated kinases, revealing how large-scale profiling can identify multitargeted inhibitors of specific, diverse kinases. The results have implications for drug development and provide a resource for selecting compounds to elucidate kinase function and for interpreting the results of experiments involving kinase inhibitors.


Conflict of interest statement

Competing Financial Interests: S.W. Deacon and H. Ma are current employees of Reaction Biology Corporation.

Figures

Figure 1
Figure 1
Large-scale inhibitor-kinase interaction analysis. (a) Distribution of the intended targets of the inhibitor library, by kinase family. (b) The distribution of kinases in the screening panel is represented by blue dots on a dendrogram representing the human kinome (Kinome illustration was adapted and is reproduced courtesy of Cell Signaling Technology, Inc. (www.cellsignal.com) based on Manning et al.). (c) Scatter plot of the kinase activity in replicate 1 versus replicate 2 for each kinase-inhibitor pair for which > 20% inhibition of kinase activity was observed. (d) Two-way hierarchical clustering analysis of the entire kinase-inhibitor interaction map presented as a heatmap of kinase activity. A fully labeled, high-resolution version of this heatmap is presented in Supplementary Figure 2, as a data table in Supplementary Table 3, and via the Kinase Inhibitor Resource (KIR) online tool (http://kir.fccc.edu).
Figure 2
Figure 2
Comparison of this study’s functional inhibition data with previous kinase-inhibitor interaction profiling studies. Scatter plots compare our results with studies that examined interactions of overlapping kinase-inhibitor pairs by (a) a quantitative kinase-inhibitor binding assay, , or (b) an assay measuring resistance to thermal denaturation by kinases in the presence of individual inhibitors. In (a), remaining kinase activity is plotted as a function of kinase- compound binding affinity (Kd) for 654 kinase-inhibitor pairs. The resulting data was fit to a sigmoidal dose-response curve (solid line) and can be compared with a theoretical curve (dotted line) for expected remaining kinase activity for an inhibitor of the given affinity. The theoretical activity curve was calculated according to the equation: activity=(100-(100/(1+(IC50/0.5 μM))) and the Cheng-Prusoff equation relating Ki and IC50. This calculation assumes a Hill coefficient of 1 for the binding and a Km,ATP of 10 μM for all kinases. In (b) remaining kinase activity is plotted against the change in melting temperature (Tm), relative to solvent control, caused by compound binding for 3,926 kinase-inhibitor pairs. The dotted vertical line denotes the Tm shift threshold used by Federov et al.. The dotted horizontal line highlights the 50% threshold for inhibition of catalytic activity. The resulting upper right quadrant includes compounds that showed significant thermal stabilization without inhibiting kinase activity whereas the lower left quadrant contains compounds which only marginally affect thermal stability yet show > 50% inhibition of catalytic activity.
Figure 3
Figure 3
Kinase selectivity. A ranked bar chart of Selectivity scores (S(50%)) for all tested kinases. This score corresponds to the fraction of all tested inhibitors that inhibit catalytic activity by >50%. Each bar represents the Selectivity score of an individual kinase. Insets identify the fourteen kinases that were not inhibited by any compound (left) and the top seven most frequently inhibited kinases (right). The complete table is presented in Supplementary Table 4.
Figure 4
Figure 4
Kinase inhibitor selectivity. (a) A ranked list of kinase inhibitors sorted by Gini score as a measure of inhibitor selectivity. A Gini score of 0 indicates equal inhibition of all kinases (promiscuous inhibition) while a score of 1 indicates inhibition of only one kinase (selective inhibition). Left inset highlights the five compounds with the lowest Gini scores and the right inset, the five highest scoring compounds. The complete table is presented in Supplementary Table 5. Below, the selectivity of three representative compounds are presented on a dendrogram of all human kinases based on amino acid sequence similarity. Spot color represents inhibitory potency: darkest, 0-10% remaining activity, lighter, 10–25% activity, lightest, 25–50% activity. The kinome dendrogram was adapted and is reproduced courtesy of Cell Signaling Technology, Inc. (www.cellsignal.com). (b) Target spectrum of 4-(4-benzyloxyanilino)-6,7-dimethoxyquinazoline, a multi-targeted inhibitor, highly selective for ErbB family members, a limited number of other tyrosine kinase targets, and the serine/threonine kinase CHK2. Each bar corresponds to the percent remaining activity for an individual kinase.
Figure 5
Figure 5
“Uni-specific” kinase inhibitors. The left panel presents a graphical table of compounds ranked based on the compound’s ability to inhibit a single kinase significantly more potently than any other kinase tested. The left boundary of each horizontal bar depicts the potency with which the compound inhibits its most sensitive target and the right boundary reflects the potency with which the next most sensitive kinase is inhibited (% remaining kinase activity is shown in bins of 5%). Thus, the horizontal length of each bar reflects the differential activity of the corresponding inhibitor against its two most potently inhibited targets. Only compounds with a differential potency of at least 5% are shown. The central table identifies the compounds that showed at least 20% differential potency, their intended targets, and their most sensitive targets. Six compounds for which the most sensitive target is not the intended target are shown in grey. In the right panel, the effect of the individual compounds on each kinase in the panel is shown in a ranked plot. * SB 202474 is a negative control compound for the p38 MAP kinase inhibitor SB 202190. ** Note that ATM kinase was not included in our test panel.

Comment in

  • Interrogating the kinome.
    Zhang C, Habets G, Bollag G. Zhang C, et al. Nat Biotechnol. 2011 Nov 8;29(11):981-3. doi: 10.1038/nbt.2021. Nat Biotechnol. 2011. PMID: 22068532 No abstract available.

References

    1. Fabian MA, et al. A small molecule-kinase interaction map for clinical kinase inhibitors. Nat Biotechnol. 2005;23:329–336. - PubMed
    1. Karaman MW, et al. A quantitative analysis of kinase inhibitor selectivity. Nat Biotechnol. 2008;26:127–132. - PubMed
    1. Fedorov O, et al. A systematic interaction map of validated kinase inhibitors with Ser/Thr kinases. Proc Natl Acad Sci U S A. 2007;104:20523–20528. - PMC - PubMed
    1. Bain J, et al. The selectivity of protein kinase inhibitors: a further update. Biochem J. 2007;408:297–315. - PMC - PubMed
    1. Davies SP, Reddy H, Caivano M, Cohen P. Specificity and mechanism of action of some commonly used protein kinase inhibitors. Biochem J. 2000;351:95–105. - PMC - PubMed

Publication types

LinkOut - more resources