. 2011 Oct 30;14(12):1607-16.
doi: 10.1038/nn.2959.

5-hmC-mediated epigenetic dynamics during postnatal neurodevelopment and aging

Affiliations

5-hmC-mediated epigenetic dynamics during postnatal neurodevelopment and aging

Keith E Szulwach et al. Nat Neurosci. .

Abstract

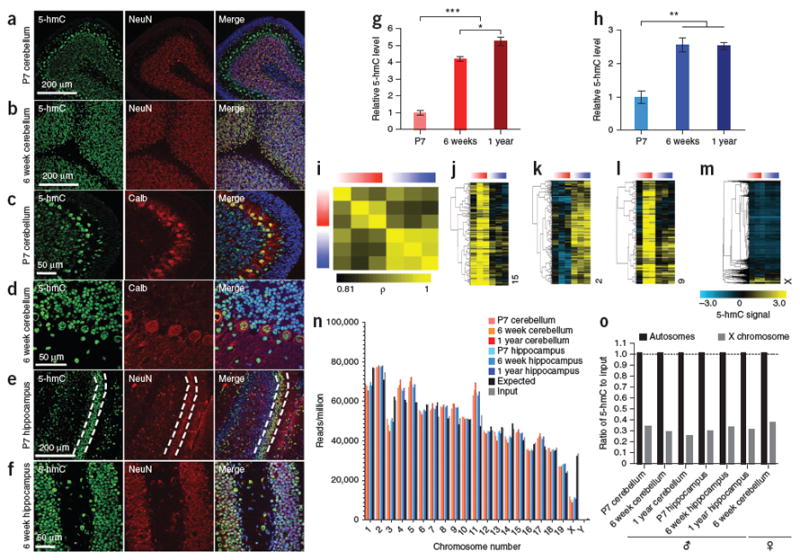
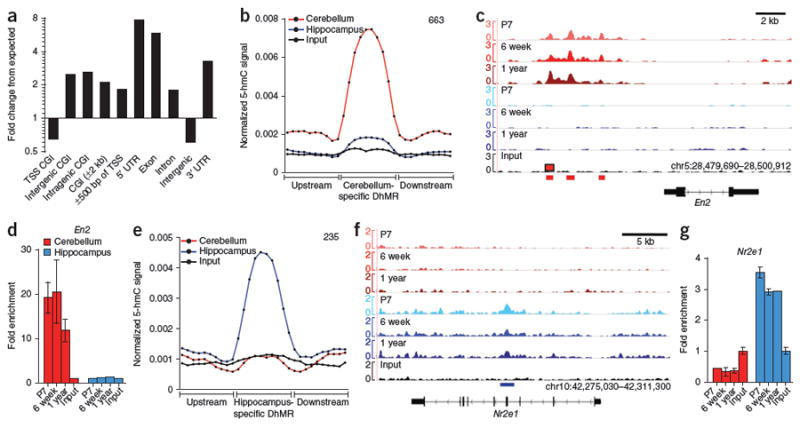
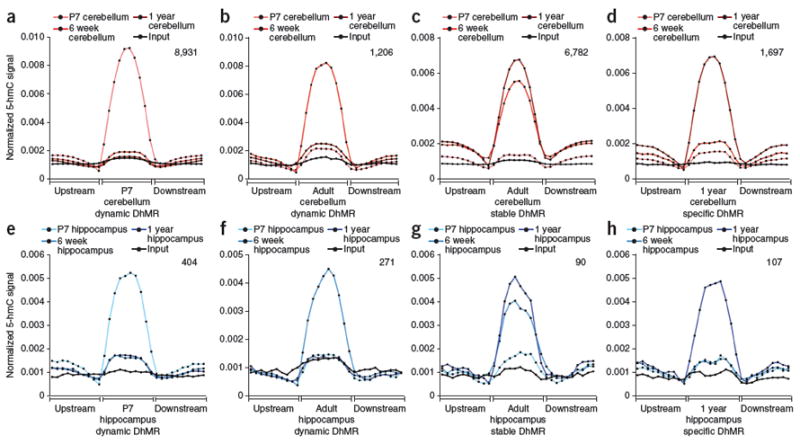
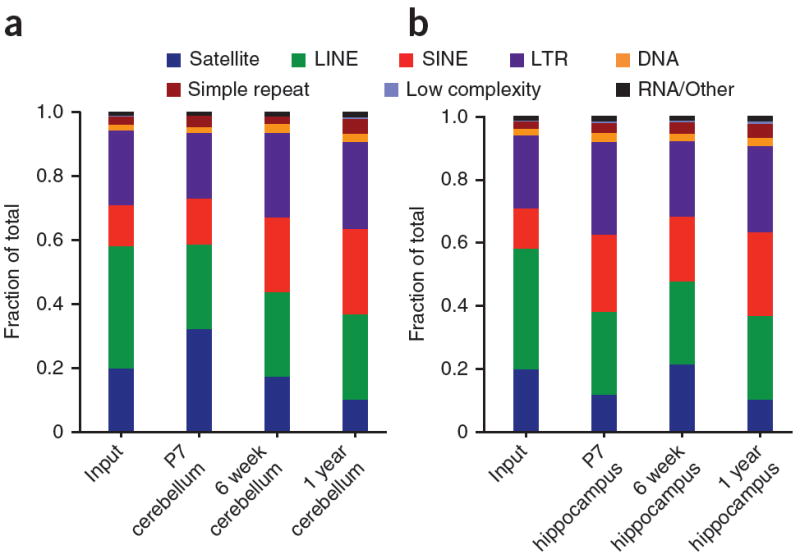
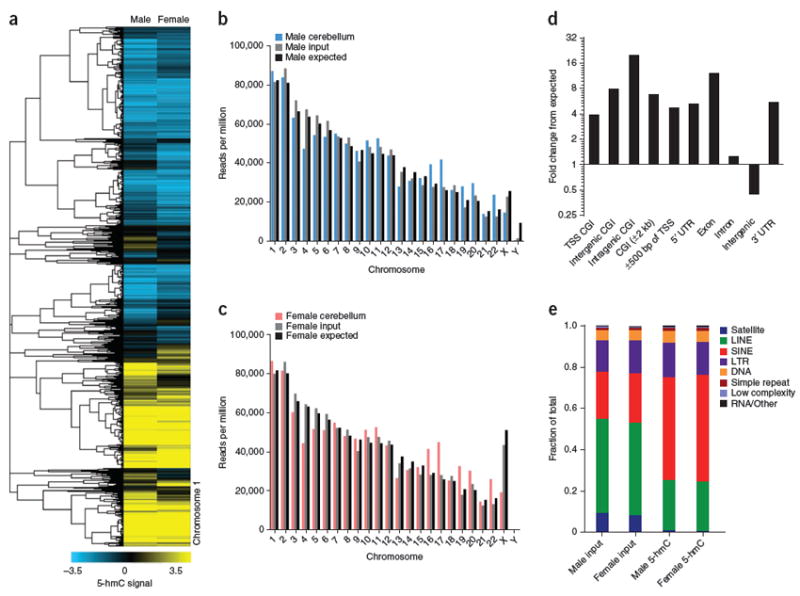
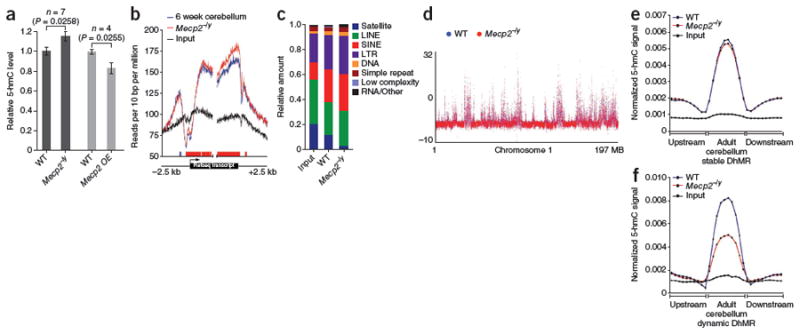
DNA methylation dynamics influence brain function and are altered in neurological disorders. 5-hydroxymethylcytosine (5-hmC), a DNA base that is derived from 5-methylcytosine, accounts for ∼40% of modified cytosine in the brain and has been implicated in DNA methylation-related plasticity. We mapped 5-hmC genome-wide in mouse hippocampus and cerebellum at three different ages, which allowed us to assess its stability and dynamic regulation during postnatal neurodevelopment through adulthood. We found developmentally programmed acquisition of 5-hmC in neuronal cells. Epigenomic localization of 5-hmC-regulated regions revealed stable and dynamically modified loci during neurodevelopment and aging. By profiling 5-hmC in human cerebellum, we found conserved genomic features of 5-hmC. Finally, we found that 5-hmC levels were inversely correlated with methyl-CpG-binding protein 2 dosage, a protein encoded by a gene in which mutations cause Rett syndrome. These data suggest that 5-hmC-mediated epigenetic modification is critical in neurodevelopment and diseases.


Conflict of interest statement

COMPETING FINANCIAL INTERESTS The authors declare no competing financial interests.

Figures

Figure 1
Figure 1. Immunostaining, quantification, and genomic mapping of 5-hmC across three ages and two brain regions in mouse
(a–f) 5-hmC–specific immunostaining in P7 (a,c) and 6 week (b,d) cerebellum, P7 (e) and 6 week (f) hippocampus. Dentate gyrus granular neurons in P7 are indicated by the dashed lines. (g,h) Quantification of 5-hmC–specific immunoblot in cerebellum and hippocampus at P7, 6 weeks and 1 year (n = 3, mean ± s.e.m.; *P < 0.05, **P < 0.01, ***P < 0.001, ANOVA). (i) Heat map of genome-wide Pearson correlations between input normalized 5-hmC binned data (10-kb bins) in hippocampus and cerebellum. In all heat maps, red indicates cerebellum and blue indicates hippocampus. (j,k) Example of tissue-specific 5-hmC loci in cerebellum and hippocampus based on genome-wide binned data (10-kb bins) identified by hierarchical clustering (uncentered complete linkage). (l) Example of developmentally programmed 5-hmC loci in cerebellum based on genome-wide binned data (10-kb bins) identified by hierarchical clustering (uncentered complete linkage). (m) Heat map of normalized 5-hmC binned data (10-kb bins) on the X chromosome (hierarchical clustering, uncentered complete linkage). For all heat maps, increasingly darker color represents increased age. In j–m, the chromosome number is indicated on the right. (n) Chromosomal read densities in hippocampus and cerebellum at each age for 5-hmC–enriched DNA, input DNA and values expected by chance. (o) Depletion of 5-hmC on the X chromosome relative to autosomes in male and female mouse brain. For the female sample, normalized 5-hmC densities were divided by input densities from the same female (GSE25398). Dashed line corresponds to 1, or no enrichment.
Figure 2
Figure 2. Identification and characterization of DhMRs
(a) Association of all identified DhMRs with various genomic features. (b) Cerebellum-specific DhMRs. DhMRs identified in each age-matched comparison between cerebellum (treatment) and hippocampus (control) were overlapped to identify the set of DhMRs specific to cerebellum at all ages. Total number of cerebellum-specific DhMRs (663) is indicated in the upper right-hand corner. (c) Genomic view of cerebellum-specific DhMRs upstream of the cerebellum-specific gene En2. Note that the cerebellum-specific peak most upstream of En2 exhibited developmentally regulated acquisition of 5-hmC from P7 to 6 week, remaining high at 1 year. (d) qPCR verification of 5-hmC enrichment in a cerebellum-specific DhMR upstream of En2 (n = 2 per age, mean ± s.e.m.). (e) Hippocampus-specific DhMRs. DhMRs identified in each age-matched comparison between hippocampus (treatment) and cerebellum (control) were overlapped to identify the set of DhMRs specific to hippocampus at all ages. Total number of hippocampus-specific DhMRs (235) is indicated in the upper right-hand corner. (f) Genomic view of a hippocampus-specific DhMR in Nr2e1. (g) qPCR verification of 5-hmC enrichment in the Nr2e1 hippocampus-specific DhMR (n = 2 per age, mean ± s.e.m.). For b and e, normalized 5-hmC signals (reads per million divided by bin size) are expressed in ten equally sized DhMR portions upstream, within and downstream of each tissue-specific DhMR. Normalized 5-hmC signals were determined at each age and then averaged across each specific brain region.
Figure 3
Figure 3. Dynamic and stable 5-hmC DhMRs in cerebellum and hippocampus
(a,e) P7 dynamic DhMRs, defined as DhMRs present at P7 relative to both 6 weeks and 1 year. Average normalized 5-hmC signals (reads per million divided by portion size) in ten equally sized DhMR portions upstream, in and downstream of DhMRs are plotted for each age. The total number of P7 cerebellum dynamic DhMRs (8,931) is indicated in the upper right-hand corner. Below is the identical analysis in hippocampus (404 total DhMRs). (b,f) 6 week dynamic DhMRs in cerebellum (1,206) and hippocampus (271) defined as DhMRs identified at 6 weeks relative to both P7 and 1 year. (c,g) Adult stable DhMRs in cerebellum (6,782) and hippocampus (90), defined as DhMRs identified at both 6 weeks and 1 year relative to P7. (d,h) 1 year–specific DhMRs in cerebellum (1,697) and hippocampus (107) defined as DhMRs identified at 1 year relative to both P7 and 6 weeks.
Figure 4
Figure 4. Analysis of repeat-associated 5-hmC
(a,b) Displayed are the fractions of total reads aligned to each class of repetitive elements annotated by RepeatMasker in P7, 6 week and 1 year cerebellum (a), and P7, 6 week and 1 year hippocampus (b). Other/RNA consists of all classes listed in RepeatMasker not otherwise specified in the legend.
Figure 5
Figure 5. Conserved features of 5-hmC in human cerebellum
(a) Genome-wide input-normalized 5-hmC signals (10-kb bins) in two adult human cerebella (34-year-old male and 40-year-old female) at chromosome 1. (b,c) Chromosome-wide densities of 5-hmC in male and female cerebellum. Values are normalized to the total number of unique nonduplicate reads, in millions, for 5-hmC and input. Expected values are determined as 106 reads per hg18 length multiplied by chromosome length. In males, expected values for the X and Y chromosomes are divided by 2. (d) Association of 5-hmC–enriched regions with genomic features. The percentage of 5-hmC–enriched regions overlapping a defined genomic feature was compared with the percentage expected to fall in that particular region by chance based on the genomic coverage of that region. Values are expressed as fold change from expected. (e) Analysis of repeat-associated 5-hmC. Displayed are the fraction of total reads aligned to each class of repetitive elements annotated by RepeatMasker in unenriched input genomic DNA and 5-hmC–enriched DNA from each sample.
Figure 6
Figure 6. Altered 5-hmC states in mouse models of Rett syndrome
(a) Quantification of 5-hmC–specific immunoblot from 6–8-week-old wild-type (WT), Mecp2–/y cerebellum (n = 7, 5 Mecp2–/ytm1.1Jae and 2 Mecp2–/ytm1.1Bird; P = 0.0258, unpaired t test), and MECP2 transgenic (OE; FVB-Tg(MECP2)1Hzo/J) mice (n = 4, P = 0.0228, unpaired t test). (b) Metagene analysis read densities around all RefSeq transcripts centered on either TSS or TTS in wild-type and Mecp2–/ytm1.1Bird cerebellum. Blocks of significantly increased 5-hmC, color-coded based on the genotype in which the increase was observed. Red indicates increased 5-hmC in Mecp2–/y and blue indicates decreased 5-hmC in wild type (P < 0.05, unpaired t test, 50-bp windows, 10-bp increments). (c) Repeat-associated 5-hmC in wild-type and Mecp2–/ytm1.1Bird cerebellum. Shown are the fractions of total reads aligned to each class of repetitive elements annotated by RepeatMasker. (d) Genomic view of input normalized binned (10 kb) data across chromosome 1. Data from each genotype are superimposed. (e) Average normalized 5-hmC signals in wild type and Mecp2–/ytm1.1Bird at cerebellum DhMRs exhibiting stability in adult (6 weeks and 1 year) relative to P7. (f) Average normalized 5-hmC signals in wild type and Mecp2–/ytm1.1Bird at cerebellum DhMRs exhibiting dynamic regulation at 6 weeks (enriched in 5-hmC at 6 weeks relative to both P7 and 1 year). Normalized 5-hmC signal is the reads per million divided by DhMR portion size, for ten equally sized DhMR portions upstream, in and downstream of DhMRs, averaged across all DhMRs analyzed.

Comment in

  • Methylation on the mind.
    Flax JD, Soloway PD. Flax JD, et al. Nat Neurosci. 2011 Nov 23;14(12):1494-6. doi: 10.1038/nn.2988. Nat Neurosci. 2011. PMID: 22119946 No abstract available.

References

    1. Jaenisch R, Bird A. Epigenetic regulation of gene expression: how the genome integrates intrinsic and environmental signals. Nat Genet. 2003;33(suppl):245–254. - PubMed
    1. Ito S, et al. Role of Tet proteins in 5mC to 5hmC conversion, ES-cell self-renewal and inner cell mass specification. Nature. 2010;466:1129–1133. - PMC - PubMed
    1. Tahiliani M, et al. Conversion of 5-methylcytosine to 5-hydroxymethylcytosine in mammalian DNA by MLL partner TET1. Science. 2009;324:930–935. - PMC - PubMed
    1. Valinluck V, et al. Oxidative damage to methyl-CpG sequences inhibits the binding of the methyl-CpG binding domain (MBD) of methyl-CpG binding protein 2 (MeCP2) Nucleic Acids Res. 2004;32:4100–4108. - PMC - PubMed
    1. Ko M, et al. Impaired hydroxylation of 5-methylcytosine in myeloid cancers with mutant TET2. Nature. 2010;468:839–843. - PMC - PubMed

Publication types

MeSH terms

Associated data