. 2011 Oct 30;12(12):1202-11.
doi: 10.1038/ni.2143.

Invariant natural killer T cells recognize lipid self antigen induced by microbial danger signals

Affiliations

Invariant natural killer T cells recognize lipid self antigen induced by microbial danger signals

Patrick J Brennan et al. Nat Immunol. .

Abstract

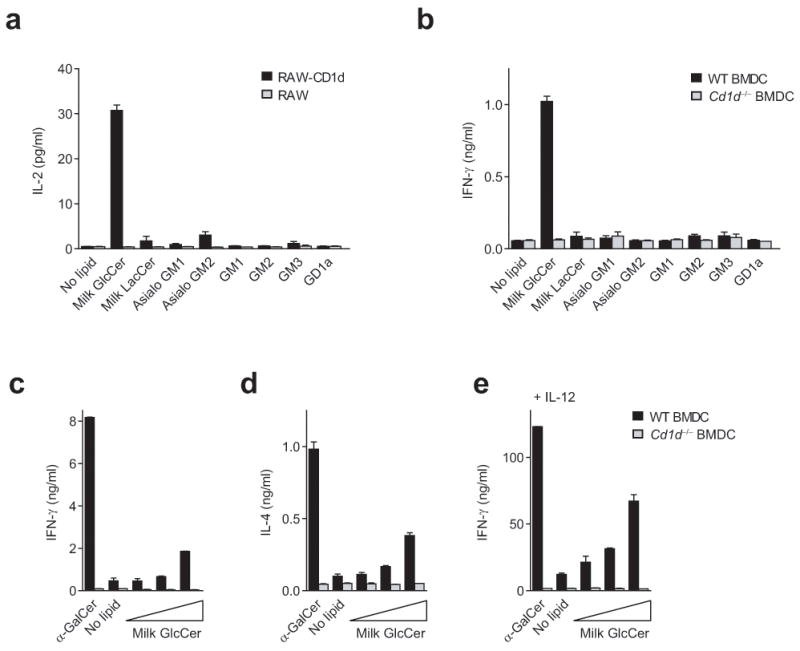
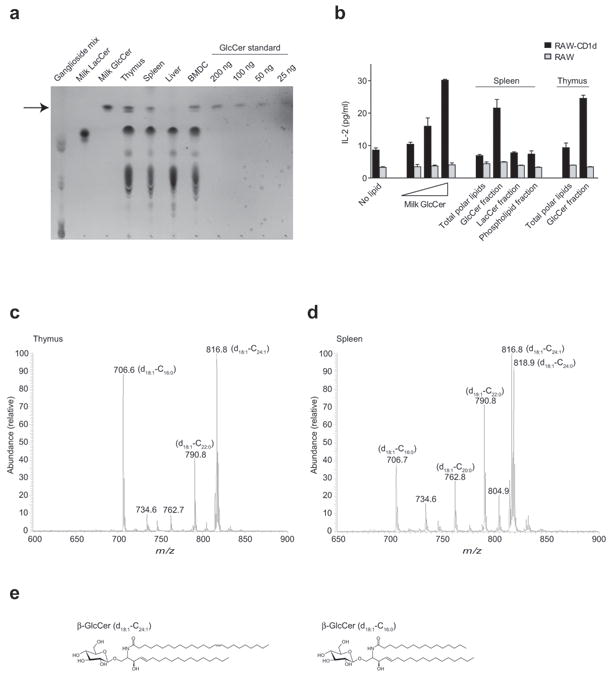
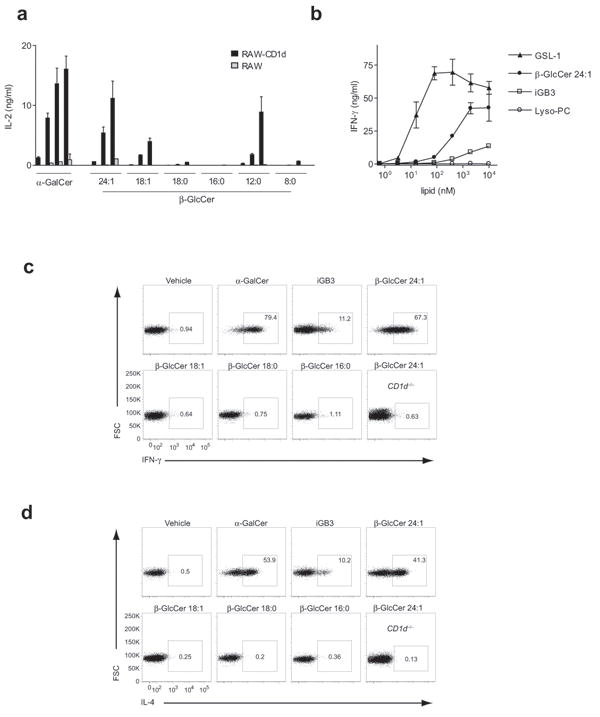
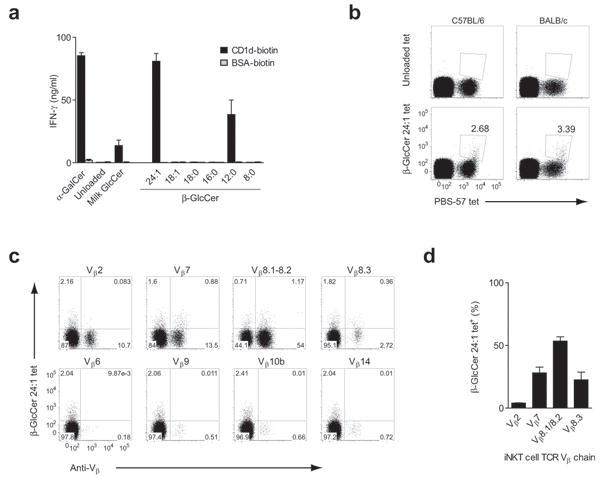
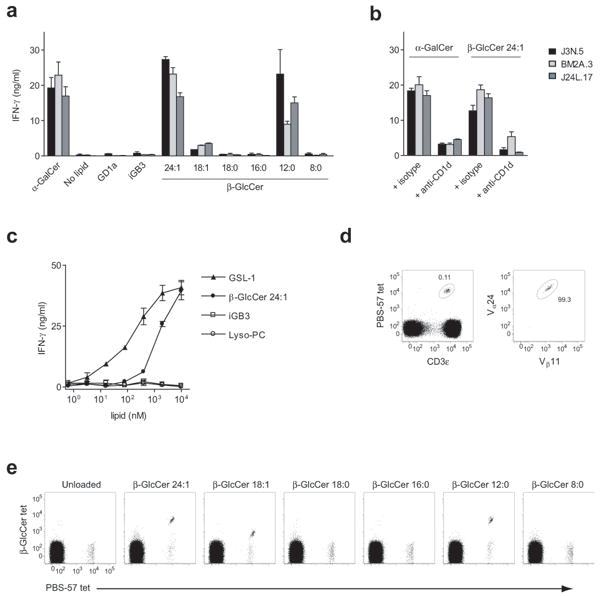
Invariant natural killer T cells (iNKT cells) have a prominent role during infection and other inflammatory processes, and these cells can be activated through their T cell antigen receptors by microbial lipid antigens. However, increasing evidence shows that they are also activated in situations in which foreign lipid antigens would not be present, which suggests a role for lipid self antigen. We found that an abundant endogenous lipid, β-D-glucopyranosylceramide (β-GlcCer), was a potent iNKT cell self antigen in mouse and human and that its activity depended on the composition of the N-acyl chain. Furthermore, β-GlcCer accumulated during infection and in response to Toll-like receptor agonists, contributing to iNKT cell activation. Thus, we propose that recognition of β-GlcCer by the invariant T cell antigen receptor translates innate danger signals into iNKT cell activation.


Figures

Figure 1
Figure 1
iNKT cell reactivity to a panel of GSLs. (a) RAW or CD1d-transfected RAW cells were co-cultured with the DN32 iNKT cell hybridoma in the presence of 10 μg/ml of the indicated lipid, and production of IL-2 was assessed by enzyme-linked immunosorbent assay (ELISA). (b) Murine CD11c+ BMDC were co-cultured with a primary iNKT cell line in the presence of 10 μg/ml of the indicated lipid. (c) IFN-γ and (d) IL-4 production in the absence of IL-12, and (e) IFN-γ production in the presence of 20 pg/ml IL-12, by a primary murine iNKT cell line co-cultured with CD11c+ BMDC in the presence of 10 ng/ml α-GalCer, or a milk β-GlcCer 5-fold dose titration with a top concentration of 20 μg/ml. IFN-γ and IL-4 production were measured by ELISA. Data are presented as mean and range of duplicate wells, and are representative of at least three independent experiments.
Figure 2
Figure 2
β-GlcCer is present in primary lymphoid tissues and activates iNKT cells. (a) TLC analysis of polar lipids extracted from murine thymus, spleen, whole liver, and BMDC along with GSL standards and milk β-GlcCer dose titration. The relative mobility of β-GlcCer is marked by an arrow. (b) The indicated lipid fractions from mouse thymus and spleen were enriched from total polar lipid extracts by normal-phase preparative HPLC as described in Supplementary Fig. 2. Enriched fractions were assayed for activity by co-culture with the iNKT hybridoma DN32 and RAW or CD1d-transfected RAW cells as APC, with a milk β-GlcCer 5-fold dose titration to a top concentration of 20 μg/ml shown for comparison. IL-2 ELISA data are presented as mean and range of duplicate wells, and are representative of two separate experiments. (c) Thymus and (d) spleen purified β-GlcCer were subjected to ESI-MS analysis in electrospary-positive mode. Major β-GlcCer ions are depicted with a lithium adduct, and fatty acid composition as determined by CID-MS is shown in parentheses. (e) Structures of two abundant β-GlcCer forms detected by ESI-MS.
Figure 3
Figure 3
iNKT cell reactivity to a β-GlcCer panel with differing N-acyl chains. (a) A β-GlcCer panel in co-culture with RAW or CD1d-transfected RAW cells and the iNKT cell hybridoma DN32. IL-2 production was determined by ELISA to a 5-fold dose titration of the indicated lipid with a top concentration of 10 μg/ml, or 10 ng/ml for α-GalCer. (b) IFN-γ production by a primary murine iNKT cell line in co-culture with wild-type CD11c+ BMDC, comparing β-GlcCer C24:1, reported iNKT cell lipid self-antigens, and a microbial GSL antigen. IL-2 and IFN-γ ELISA data are presented as mean and range in duplicate wells, and are representative of three separate experiments. (c) IFN-γ and (d) IL-4 cytokine capture assay in liver mononuclear cells following intravenous injection of the indicated lipid. Mice were injected intravenously with 25 μg of the indicated lipid, or 1 μg for α-GalCer. The TCRβ+PBS-57 (α-GalCer analog)-loaded tetramer+ gate is shown except for the last plot in each panel, where the total TCRβ+ gate is shown for a β-GlcCer C24:1-injected CD1d-deficient mouse. The percentage of iNKT cells producing IFN-γ or IL-4 is indicated for each plot. Results are representative of at three independent experiments. The structures of the synthetic lipids used here are depicted in Supplementary Fig. 4, and as all contained a d18:1 shingenine base, they are abbreviated in this and other figures with only the N-acyl chain composition listed. For example, “β-GlcCer 24:1” represents β-D-glucopyranosylceramide d18:1-C24:1.
Figure 4
Figure 4
β-GlcCer presented by CD1d activates iNKT cells via cognate TCR interaction. (a) CD1d was loaded with equal molar concentrations of the indicated lipid. Loaded CD1d, or mock-loaded bovine serum albumin (BSA), was plate-bound and used to stimulate a primary murine iNKT cell line. IFN-γ ELISA data are presented as mean and range in duplicate wells. (b) Freshly-isolated splenocytes from C57Bl/6 and BALB/c mice were co-stained with PBS-57 CD1d tetramer and unloaded or β-GlcCer C24:1-loaded CD1d tetramer. TCRβ+CD19-cells are shown, and the percentage of iNKT cells that stained positive with β-GlcCer C24:1-loaded tetramer is shown. (c) C57Bl/6 splenocytes were stained with β-GlcCer C24:1 CD1d tetramer and the TCR Vβ antibody indicated above each plot. The CD3 molecular complex+CD19-PBS-57 tetramer+ gate is shown in each plot, with quadrants based on unloaded tetramer staining. (d) The percentage of iNKT cells from the β-GlcCer C24:1 tetramer+ population bearing each indicated TCR Vβ, with data presented as mean + s.e.m. from three separate experiments.
Figure 5
Figure 5
β-GlcCer is a cognate antigen for human iNKT cells. (a) Three human iNKT cell clones designated J3N.5, BM2A.3, and J24L.17, were co-cultured with human PBMC-derived monocytes in the presence of 10 μg/ml of the indicated lipid, or 10 ng/ml for α-GalCer, and (b) in the presence of an anti-CD1d or isotype control monoclonal antibody. (c) IFN-γ production by a primary human iNKT cell line in co-culture with PBMC-derived monocytes, comparing β-GlcCer C24:1 to reported iNKT cell lipid self-antigens and a microbial GSL antigen. IFN-γ production was assessed by ELISA, and is presented as mean and range in duplicate wells. (d) Left, anti-CD3ε and PBS-57 tetramer were used to identify iNKT cells. Right, CD3ε+/PBS-57 tetramer+ gated cells were co-stained with anti-Vβ24 and anti-Vβ11 to confirm invariant TCR chain usage. (e) PBMC were co-stained with PBS-57-loaded CD1d tetramer and CD1d tetramers loaded with the β-GlcCer N-acyl chain variant indicated above each plot. The CD3ε+ gate is shown. Note that CD1d tetramers loaded with β-GlcCer C24:1, C18:1, and C12:0 stain human iNKT cells. Data are representative of at least three separate experiments.
Figure 6
Figure 6
β-GlcCer contributes to iNKT cell self-reactivity. (a) CD11c+ BMDC were co-cultured with an iNKT cell line at a 1:5 ratio in the presence of inhibitors of β-GlcCer synthesis, NB-DGJ or D-PDMP, and iNKT IFN-γ production was determined by ELISA. (b) IFN-γ production by iNKT cells co-cultured with CD11c+ BMDC and Gal–α-GalCer, an antigenic lipid that requires lysosomal processing, was measured in the presence of β-GlcCer synthesis inhibitors. (c) siRNA silencing of Ugcg and B4galt6, assessed by quantitative PCR (qPCR) relative to Gapdh, was performed in CD11c+ BMDC, and after 48 hrs, BMDC were harvested and (d) co-cultured with a primary iNKT cell line at the indicated ratio. Autoreactivity was assessed by cytokine ELISA. (e) The presentation of Gal–α-GalCer by siRNA-silenced CD11c+ BMDC was assessed by measuring IFN-γ production by an iNKT cell line after co-culture. (f) CD1d surface expression on CD11c+ BMDC was measured by flow cytometry 48 hrs after the introduction of siRNA. ELISA data are presented as mean and range in duplicate wells, and data are representative of three separate experiments.
Figure 7
Figure 7
A role for β-GlcCer in the iNKT cell response to LPS-exposed BMDC. (a) CD11c+ BMDC were exposed to 1 ng/ml LPS for the indicated period of time, and the expression of genes involved in β-GlcCer metabolism was analyzed by qPCR. Expression data relative to Gapdh representative of three separate experiments is presented, error being the s.e.m. among triplicate samples. (b) TLC analysis of polar lipid extracts from LPS-treated CD11c+ BMDC, with the relative mobility of β-GlcCer marked by an arrow. (c) Densitometic analysis for the upper and lower β-GlcCer TLC bands, with error reported as s.d. of band intensity. (d) IFN-γ production by an iNKT cell line co-cultured with CD11c+ BMDC in the presence of LPS and the indicated inhibitor of β-GlcCer synthesis. (e) siRNA silencing was performed in CD11c+ BMDC, and after 48 hrs, BMDC were harvested and co-cultured with a primary iNKT cell line in the presence of LPS. ELISA data are presented as mean and range in duplicate wells. For all data in this figure, three independent experiments were performed.
Figure 8
Figure 8
β-GlcCer contributes to microbial activation of iNKT cells. (a) A primary iNKT cell line was co-cultured with Ugcg, B4galt6, or control siRNA-silenced CD11c+ BMDC in the presence of heat-killed bacteria, and activation was assessed by IFN-γ production. ELISA data are presented as mean and range in duplicate wells, and are representative of three separate experiments. (b) Mice were infected with E. coli intravenously, and spleens harvested on days 1 and 2. Polar lipid extracts were extracted and analyzed by TLC. (c) TLC analysis of whole lung lipid extracts from days 1 and 3 following intranasal S. pneumoniae infection. A TLC solvent system that allowed separation of bacterial GlcDAG from β-GlcCer was utilized. The relative mobility of β-GlcCer is marked by an arrow. Densitometric quantification of β-GlcCer bands is shown, and each point represents data obtained from an individual mouse.

Comment in

  • Beta-testing NKT cell self-reactivity.
    Godfrey DI, Pellicci DG, Rossjohn J. Godfrey DI, et al. Nat Immunol. 2011 Nov 16;12(12):1135-7. doi: 10.1038/ni.2162. Nat Immunol. 2011. PMID: 22089211 No abstract available.

References

    1. Brigl M, Brenner MB. CD1: antigen presentation and T cell function. Annu Rev Immunol. 2004;22:817–890. - PubMed
    1. Godfrey DI, Kronenberg M. Going both ways: immune regulation via CD1d-dependent NKT cells. J Clin Invest. 2004;114:1379–1388. - PMC - PubMed
    1. Kawano T, et al. CD1d-restricted and TCR-mediated activation of valpha14 NKT cells by glycosylceramides. Science. 1997;278:1626–1629. - PubMed
    1. Kinjo Y, et al. Natural killer T cells recognize diacylglycerol antigens from pathogenic bacteria. Nat Immunol. 2006;7:978–986. - PubMed
    1. Kinjo Y, et al. Recognition of bacterial glycosphingolipids by natural killer T cells. Nature. 2005;434:520–525. - PubMed

Publication types