. 2012 Jan 30;141(2):227-34.
doi: 10.1016/j.imlet.2011.10.009. Epub 2011 Oct 20.

Potential role for alternatively activated macrophages in the secondary bacterial infection during recovery from influenza

Affiliations

Potential role for alternatively activated macrophages in the secondary bacterial infection during recovery from influenza

Wilbur H Chen et al. Immunol Lett. .

Abstract

Purpose: Secondary bacterial infections are a common complication of influenza. Innate immune host defenses appear to be impaired following influenza, leading to susceptibility to subsequent bacterial infections. Alternatively activated macrophages (AAM) in the lungs may play a critical role in eliciting the hypersusceptibility to secondary bacterial pneumonia.

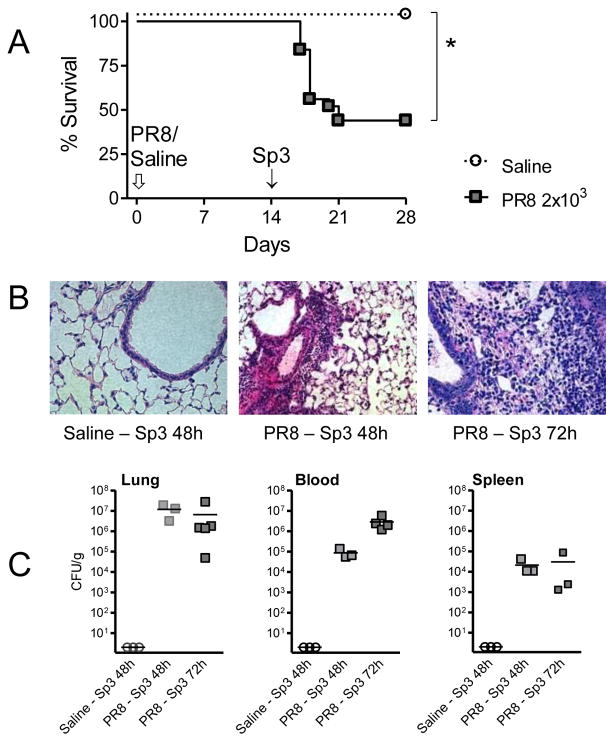
Methods: C57BL6 mice were challenged with sublethal doses of the mouse-adapted A/PR/8/34 (PR8) influenza virus or saline and allowed to recover. At complete recovery (day 14), mice were re-challenged with sublethal doses of Streptococcus pneumoniae serotype 3 (Sp3).

Results: PR8-recovered mice developed a rapidly fatal pulmonary infection to a 100-fold sublethal pneumococcal challenge, whereas PR8-naive mice demonstrated no mortality or illness. The cytokines which induce AAM (IL-4 and IL-13) and the expression of genes associated with AAM (Arginase-1, FIZZ1, and YM1) were elevated after PR8 infection. Flow cytometry suggests that alveolar macrophages demonstrate the AAM-phenotype, as indicated by MGL-1 and MHCII expression, in response to PR8 infection. Recovery from PR8 was associated with blunted cytokine responses to TLR ligands.

Conclusions: The mechanisms of immune regulation during recovery from influenza are being elucidated. We provide evidence that pulmonary AAM are induced during influenza infection and may contribute to the elicitation of hypersusceptibility to a secondary bacterial infection.


Figures

Figure 1
Figure 1. Recovery from primary PR8 influenza strain infection
(Panel A) The changes in weight after challenge with saline (n=10), PR8 2×10³ TCID50 (n=20), and PR8 2×10⁴ TCID50 (n=17) were recorded and show recovery of weight by day 14 among mice receiving sublethal (PR8 2×10³ TCID50) infection. * indicates that at day 9, there is incomplete data due to 65% mortality. The viral counts from lungs and BAL fluid (Panel B) and H&E stains on lungs (Panel C, 40X magnification) were performed on the days indicated after challenge with sublethal (PR8 2×10³ TCID50) infection and show clearance of virus by day 10 and normalization of lung histology at day 14. ND = not detectable.
Figure 2
Figure 2. Lethality of secondary Sp3 infection during recovery (14 days) from a primary influenza infection
(Panel A) Kaplan-Meier curves were created for mice that recovered from primary saline (n=11) or PR8 2×10³ TCID50 (n=25) followed by challenge with sublethal 5×10³ CFU of Sp3 and show significant hypersusceptibility during recovery from influenza; Logrank p-values are indicated. Mice challenged with sublethal Sp3 (5×10³ CFU) show significant inflammatory cell infiltration (Panel B) on lung H&E staining (40X magnification) and pneumococcal dissemination on organ bacterial counts (Panel C) at the times indicated among mice in recovery (day 14) from sublethal PR8 (2×10³ TCID50) infection. *p=0.002 **p=0.0002
Figure 3
Figure 3. Gene expression associated with AAM
Gene expression was measured from the lungs of mice at the indicated times after sublethal PR8 ± Sp3 infection for the direct inducers (Panel A) and prototype signature markers (Panel B) of AAM and for anti-inflammatory (Panel C) and pro-inflammatory (Panel D) cytokines. Gene expression by real-time PCR is reported as relative gene expression compared with lungs of mice exposed to saline only. Experiments were performed in triplicate and data are presented as mean ± SEM. *p <0.05 **p<0.005
Figure 4
Figure 4. Flow cytometric identification of the AAM phenotype
(Panel A) Primary murine macrophages that were treated with IL-4 (AAM, solid line) stained positive for MGL-1, whereas un-treated macrophages (CM, dashed line) lacked the expression of this marker. (Panel B) Lung homogenates were stained with a multichromatic flow cytometry panel (Naïve mouse shown). The plot depicts CD11b and CD11c following exclusion of dead cells (ViviD) and granulocytes (Gr1+). Populations identified were interrogated for the expression of MGL-1, MHCII, F4/80, and autofluorescence. Only alveolar macrophages (AM, Gr1 CD11b CD11chigh) stained positive for MGL-1; they also were MHCIIdim and highly autofluorescent. DC (dendritic cell) and CM (classical macrophage) do not express MGL-1.
Figure 5
Figure 5. Kinetics of lung AAM
AAM were defined as alveolar macrophages (autofluorescent Gr1 CD11b CD11chigh F4/80dim) which express both MGL-1 and MHCII. Panel A depicts the MGL-1 and MHCII positive alveolar macrophage population after sublethal PR8 ± Sp3 infection. (Panel B) The percentage of lung AAM (percentage relative to alveolar macrophages) after sublethal PR8 ± Sp3 are summarized in 5–95 percentile box-whisker plots (line indicates mean values). (Panel C) The numbers of AAM per gram of lung tissue after sublethal PR8 ± Sp3 are summarized in minimum-maximum box-whisker plots (line indicates mean values) with dots that indicate individual animal data. Panel D summarizes the number of CM (Gr1 MGL-1 CD11b+ CD11c- F4/80+) per gram of lung tissue after sublethal PR8 ± Sp3, by minimum-maximum box-whisker plots (line indicates mean values) with dots that indicate individual animal data. The data are from 3 separate experiments. *p <0.05.
Figure 6
Figure 6. Blunted splenocyte responses to TLR stimuli
Splenocytes from mice at the indicated times after sublethal PR8 infection were stimulated with: medium alone (non-stimulated), 100 ng/mL LPS, 10 μg/mL CpG, or 100 ng/mL Pam3Cys. After 18 h incubation, supernatants were harvested and cytokine production was measured by ELISA. Data are expressed as the mean ± SEM of cytokine production and are representative of three independent experiments for Day 0 and 14, two experiments for Day 3. *p <0.05 **p<0.005

Similar articles

Cited by

References

    1. Morens DM, Taubenberger JK, Fauci AS. Predominant role of bacterial pneumonia as a cause of death in pandemic influenza: implications for pandemic influenza preparedness. J Infect Dis. 2008;198:962–970. - PMC - PubMed
    1. LOURIA DB, BLUMENFELD HL, ELLIS JT, KILBOURNE ED, ROGERS DE. Studies on influenza in the pandemic of 1957–1958. II. Pulmonary complications of influenza. J Clin Invest. 1959;38:213–265. - PMC - PubMed
    1. HERS JF, MASUREL N, MULDER J. Bacteriology and histopathology of the respiratory tract and lungs in fatal Asian influenza. Lancet. 1958;2:1141–1143. - PubMed
    1. Lindsay MI, Jr, Herrmann EC, Jr, Morrow GW, Jr, Brown AL., Jr Hong Kong influenza: clinical, microbiologic, and pathologic features in 127 cases. JAMA. 1970;214:1825–1832. - PubMed
    1. Kashiwagi S, Ikematsu H, Hayashi J, Nomura H, Kajiyama W, Kaji M. An outbreak of influenza A (H3N2) in a hospital for the elderly with emphasis on pulmonary complications. Jpn J Med. 1988;27:177–182. - PubMed

Publication types

MeSH terms