

Improved detection of myocardial involvement in acute inflammatory cardiomyopathies using T2 mapping
- PMID: 22038988
- PMCID: PMC3261300
- DOI: 10.1161/CIRCIMAGING.111.967836
Improved detection of myocardial involvement in acute inflammatory cardiomyopathies using T2 mapping
Abstract
Background: T2-weighted cardiac magnetic resonance imaging is useful in diagnosing acute inflammatory myocardial diseases, such as myocarditis and tako-tsubo cardiomyopathy (TTCM). We hypothesized that quantitative T2 mapping could better delineate myocardial involvement in these disorders versus T2-weighted imaging.
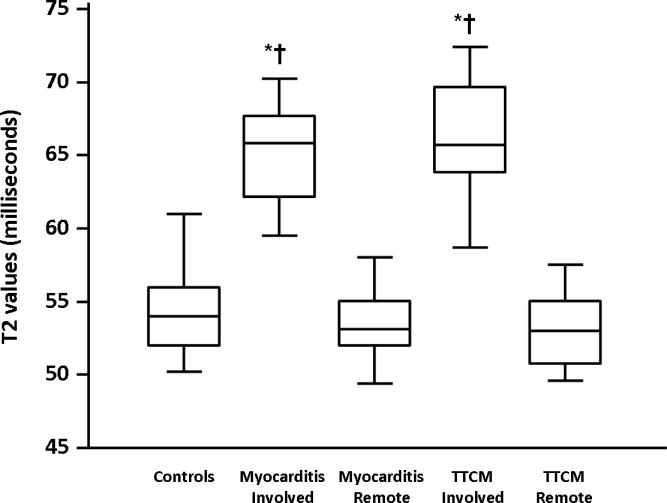
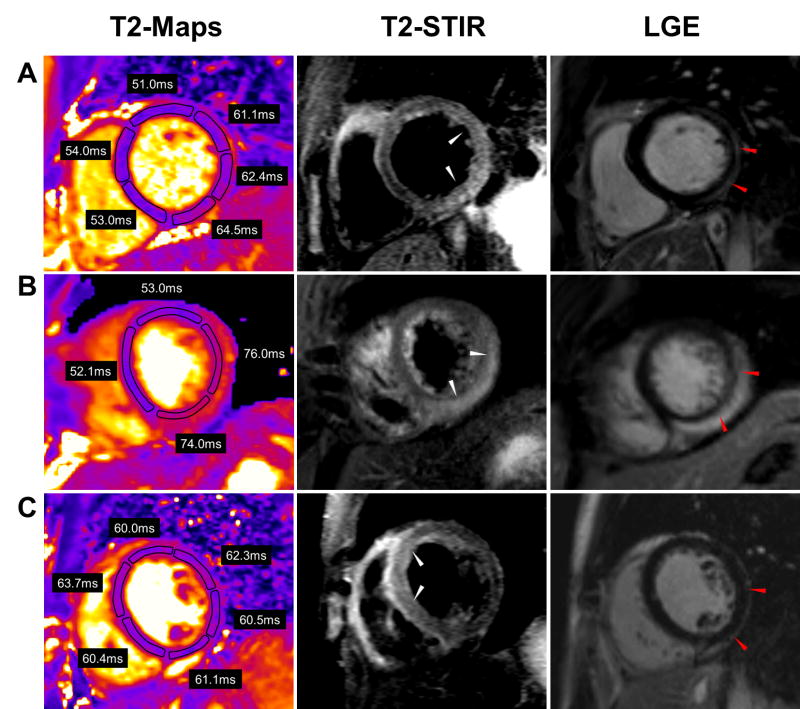
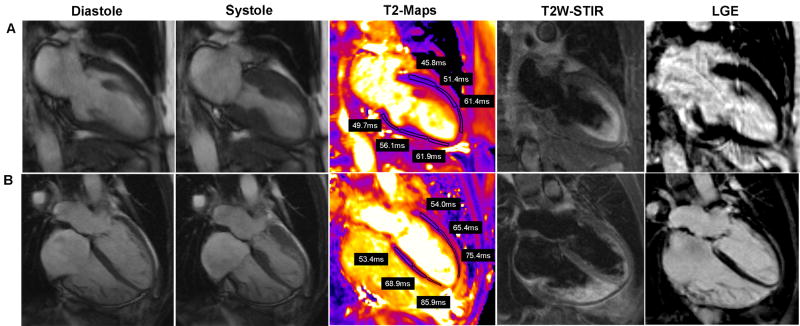
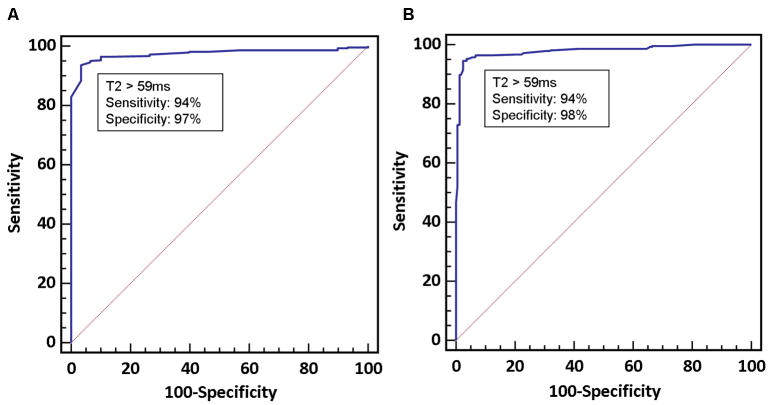
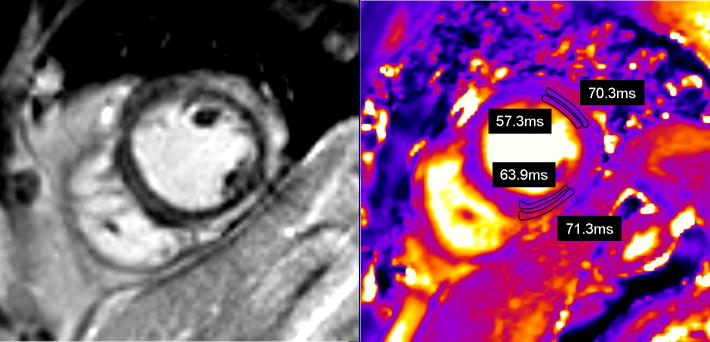
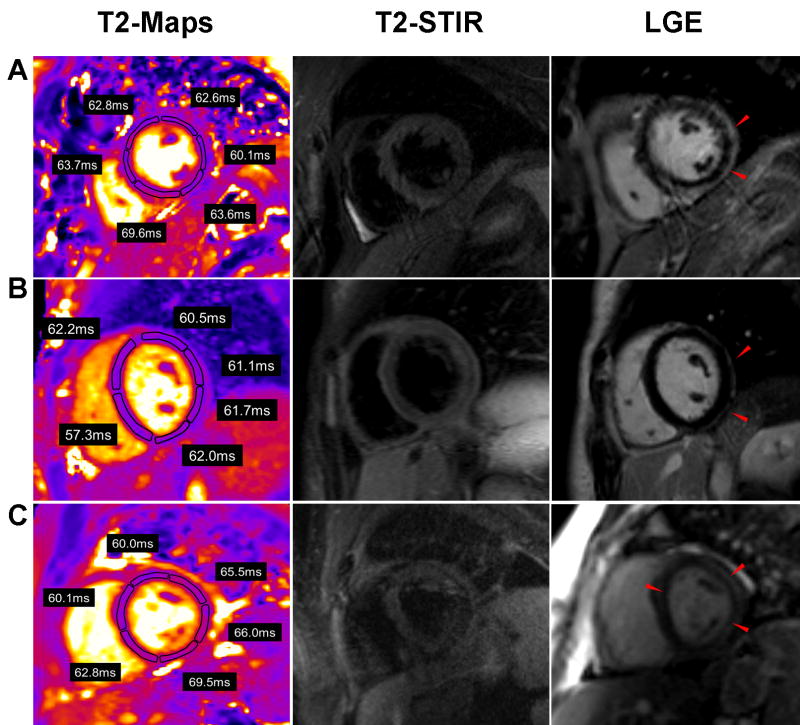
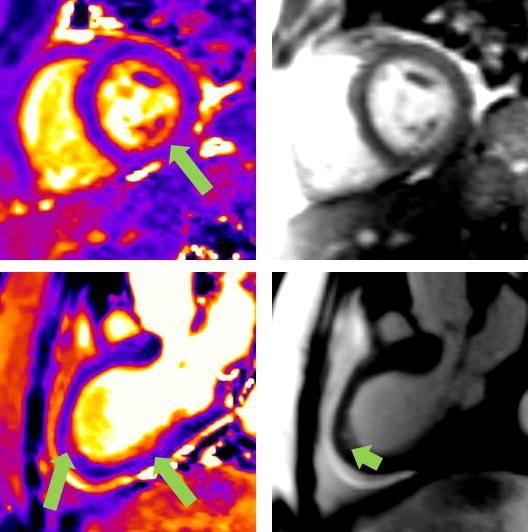
Methods and results: Thirty patients with suspected myocarditis or TTCM, referred for cardiac magnetic resonance imaging, who met established diagnostic criteria underwent myocardial T2 mapping. T2 values were averaged in involved and remote myocardial segments, both defined by a reviewer blinded to T2 data. In myocarditis, T2 was 65.2±3.2 ms in the involved myocardium versus 53.5±2.1 ms in the remote myocardium (P<0.001). In TTCM, T2 was 65.6±4.0 ms in the involved myocardium versus 53.6±2.7 ms in the remote segments (P<0.001). T2 values were similar across remote myocardial segments in patients and all myocardial segments in controls (P>0.05 for all). T2 maps provided diagnostic data even in patients with difficulty breath holding. A T2 cutoff of 59 ms identified areas of myocardial involvement, with sensitivity and specificity of 94% and 97%, respectively. T2 mapping revealed regions of abnormal T2 beyond those identified by wall motion abnormalities or late gadolinium-enhancement positivity. Conventional T2-weighted short tau inversion recovery images were uninterpretable in 7 patients because of artifact and unremarkable in 2 patients who had elevated T2 values. T2-prepared steady-state-free precession images showed areas of signal hyperintensity in only 17 of 30 patients.
Conclusions: Quantitative T2 mapping reliably identifies myocardial involvement in patients with myocarditis and TTCM. T2 mapping delineated a greater extent of myocardial disease in both conditions compared with that identified by wall motion abnormalities, T2-weighted short tau inversion recovery imaging, T2-prepared steady-state-free precession, or late gadolinium enhancement. Quantitative T2 mapping warrants consideration as a robust technique to identify myocardial injury in patients with acute myocarditis or TTCM.
Figures
References
-
- Eitel I, Behrendt F, Schindler K, Kivelitz D, Gutberlet M, Schuler G, Thiele H. Differential diagnosis of suspected apical ballooning syndrome using contrast-enhanced magnetic resonance imaging. Eur Heart J. 2008;29:2651–2659. - PubMed
-
- Abdel-Aty H, Cocker M, Friedrich MG. Myocardial edema is a feature of Tako-Tsubo cardiomyopathy and is related to the severity of systolic dysfunction: insights from T2-weighted cardiovascular magnetic resonance. Int J Cardiol. 2009;132:291–293. - PubMed
-
- Abdel-Aty H, Boye P, Zagrosek A, Wassmuth R, Kumar A, Messroghli D, Bock P, Dietz R, Friedrich MG, Schulz-Menger J. Diagnostic performance of cardiovascular magnetic resonance in patients with suspected acute myocarditis: comparison of different approaches. J Am Coll Cardiol. 2005;45:1815–1822. - PubMed
-
- Friedrich MG, Sechtem U, Schulz-Menger J, Holmvang G, Alakija P, Cooper LT, White JA, Abdel-Aty H, Gutberlet M, Prasad S, Aletras A, Laissy JP, Paterson I, Filipchuk NG, Kumar A, Pauschinger M, Liu P. Cardiovascular magnetic resonance in myocarditis: A JACC White Paper. J Am Coll Cardiol. 2009;53:1475–1487. - PMC - PubMed
-
- Pennell D. Myocardial salvage: retrospection, resolution, and radio waves. Circulation. 2006;113:1821–1823. - PubMed
Publication types
MeSH terms
Substances
Grants and funding
LinkOut - more resources
Full Text Sources
Other Literature Sources
Medical
Miscellaneous
