

Universal definition of loss to follow-up in HIV treatment programs: a statistical analysis of 111 facilities in Africa, Asia, and Latin America
- PMID: 22039357
- PMCID: PMC3201937
- DOI: 10.1371/journal.pmed.1001111
Universal definition of loss to follow-up in HIV treatment programs: a statistical analysis of 111 facilities in Africa, Asia, and Latin America
Abstract
Background: Although patient attrition is recognized as a threat to the long-term success of antiretroviral therapy programs worldwide, there is no universal definition for classifying patients as lost to follow-up (LTFU). We analyzed data from health facilities across Africa, Asia, and Latin America to empirically determine a standard LTFU definition.
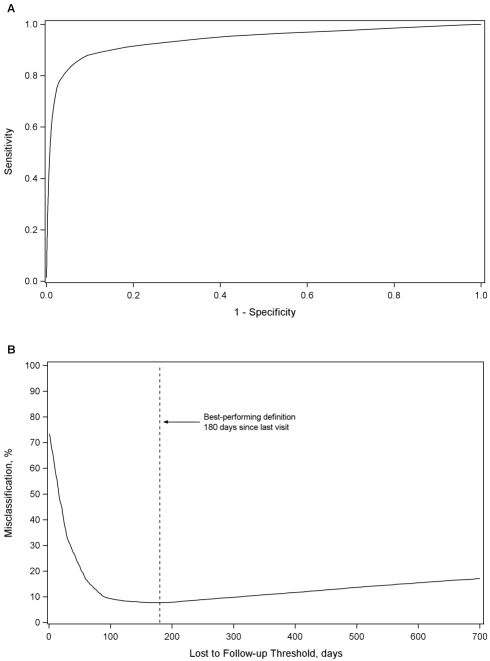
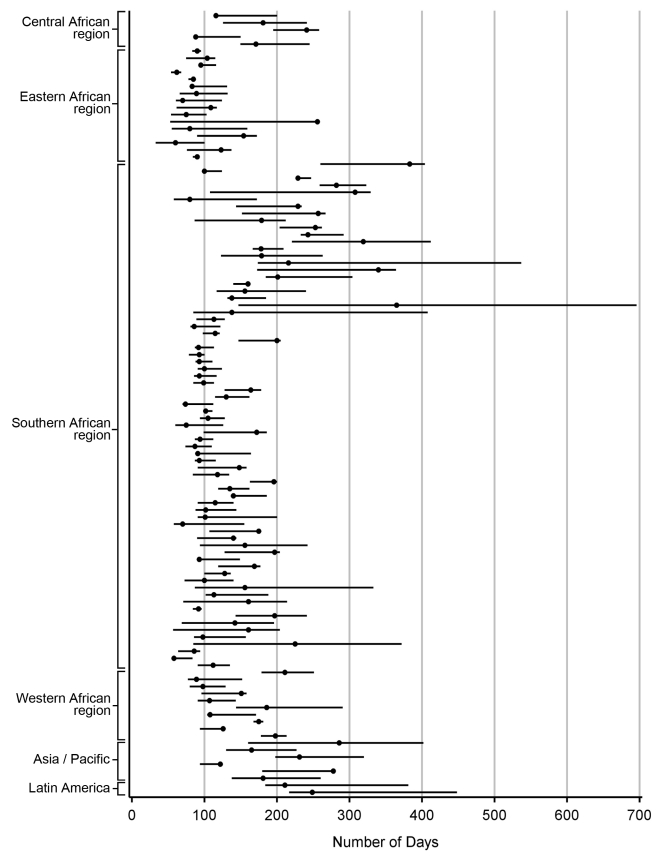
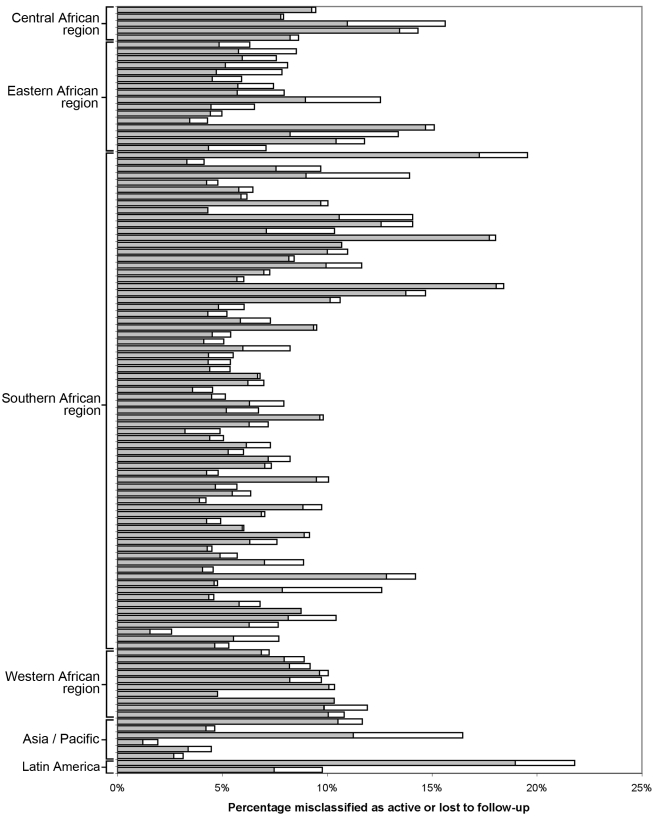
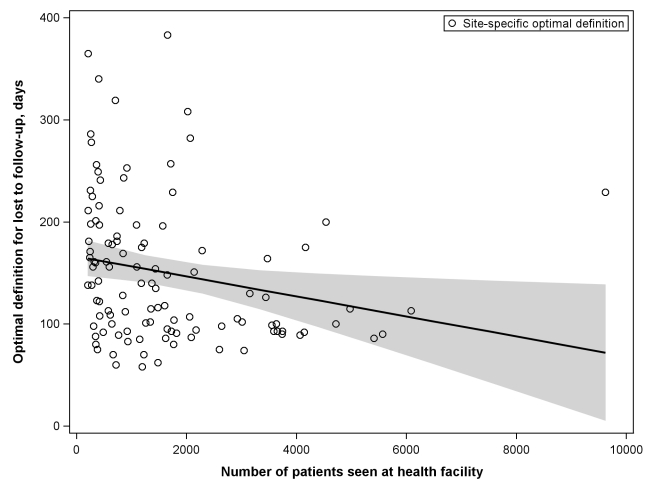
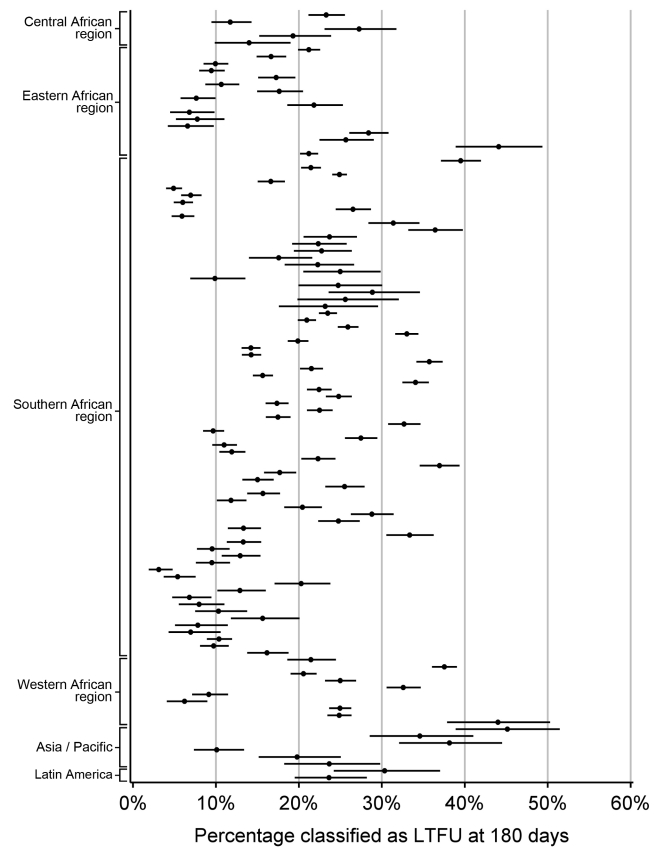
Methods and findings: At a set "status classification" date, patients were categorized as either "active" or "LTFU" according to different intervals from time of last clinic encounter. For each threshold, we looked forward 365 d to assess the performance and accuracy of this initial classification. The best-performing definition for LTFU had the lowest proportion of patients misclassified as active or LTFU. Observational data from 111 health facilities-representing 180,718 patients from 19 countries-were included in this study. In the primary analysis, for which data from all facilities were pooled, an interval of 180 d (95% confidence interval [CI]: 173-181 d) since last patient encounter resulted in the fewest misclassifications (7.7%, 95% CI: 7.6%-7.8%). A secondary analysis that gave equal weight to cohorts and to regions generated a similar result (175 d); however, an alternate approach that used inverse weighting for cohorts based on variance and equal weighting for regions produced a slightly lower summary measure (150 d). When examined at the facility level, the best-performing definition varied from 58 to 383 d (mean=150 d), but when a standard definition of 180 d was applied to each facility, only slight increases in misclassification (mean=1.2%, 95% CI: 1.0%-1.5%) were observed. Using this definition, the proportion of patients classified as LTFU by facility ranged from 3.1% to 45.1% (mean=19.9%, 95% CI: 19.1%-21.7%).
Conclusions: Based on this evaluation, we recommend the adoption of ≥180 d since the last clinic visit as a standard LTFU definition. Such standardization is an important step to understanding the reasons that underlie patient attrition and establishing more reliable and comparable program evaluation worldwide. Please see later in the article for the Editors' Summary.
Conflict of interest statement
The authors have declared that no competing interests exist.
Figures
References
-
- Joint United Nations Programme on HIV/AIDS. Towards universal access: scaling up priority HIV/AIDS interventions in the health sector, progress report 2009. Geneva: World Health Organization; 2009.
-
- World Health Organization. Progress on global access to HIV antiretroviral therapy: a report on “3 by 5” and beyond, March 2006. Geneva: World Health Organization; 2006.
-
- Rosen S, Fox MP, Gill CJ. Patient retention in antiretroviral therapy programs in sub-Saharan Africa: a systematic review. PLoS Med. 2007;4:e298. doi: 10.1371/journal.pmed.0040298. - DOI - PMC - PubMed
Publication types
MeSH terms
Grants and funding
- P30 AI027767/AI/NIAID NIH HHS/United States
- U01AI069924/AI/NIAID NIH HHS/United States
- U01 AI069927/AI/NIAID NIH HHS/United States
- U01 AI069923/AI/NIAID NIH HHS/United States
- U01AI069907/AI/NIAID NIH HHS/United States
- U01AI069919/AI/NIAID NIH HHS/United States
- D43-TW001035/TW/FIC NIH HHS/United States
- U01AI069923/AI/NIAID NIH HHS/United States
- U01 AI069924/AI/NIAID NIH HHS/United States
- P30 AI027763/AI/NIAID NIH HHS/United States
- U01 AI069919/AI/NIAID NIH HHS/United States
- U01 AI069907/AI/NIAID NIH HHS/United States
- U01AI069927/AI/NIAID NIH HHS/United States
- D43 TW001035/TW/FIC NIH HHS/United States
- P30-AI027767/AI/NIAID NIH HHS/United States
