. 2011;6(10):e26410.
doi: 10.1371/journal.pone.0026410. Epub 2011 Oct 19.

Imprinted genes that regulate early mammalian growth are coexpressed in somatic stem cells

Affiliations

Imprinted genes that regulate early mammalian growth are coexpressed in somatic stem cells

Jonathan S Berg et al. PLoS One. 2011.

Abstract

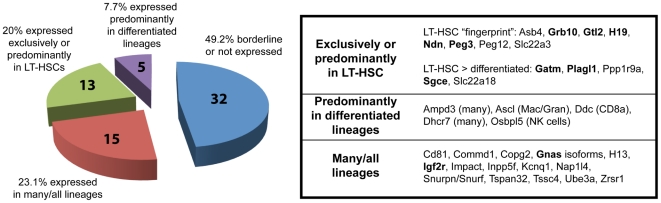
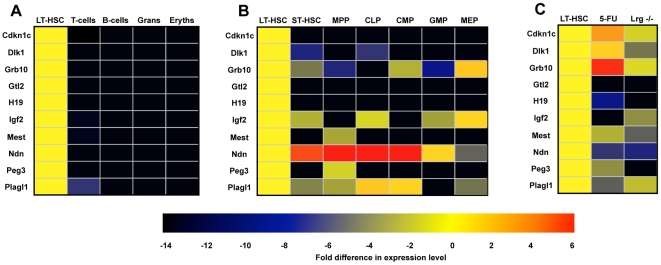
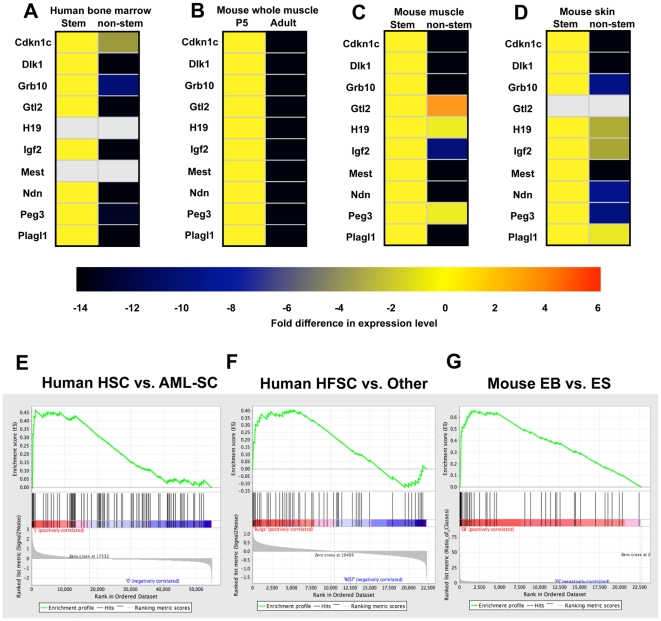
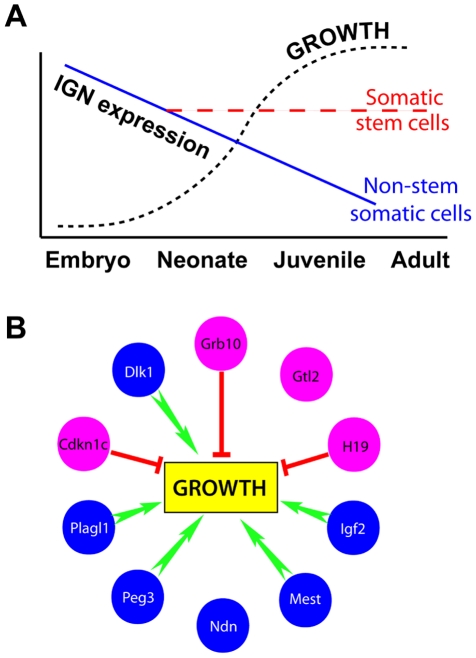
Lifelong, many somatic tissues are replenished by specialized adult stem cells. These stem cells are generally rare, infrequently dividing, occupy a unique niche, and can rapidly respond to injury to maintain a steady tissue size. Despite these commonalities, few shared regulatory mechanisms have been identified. Here, we scrutinized data comparing genes expressed in murine long-term hematopoietic stem cells with their differentiated counterparts and observed that a disproportionate number were members of the developmentally-important, monoallelically expressed imprinted genes. Studying a subset, which are members of a purported imprinted gene network (IGN), we found their expression in HSCs rapidly altered upon hematopoietic perturbations. These imprinted genes were also predominantly expressed in stem/progenitor cells of the adult epidermis and skeletal muscle in mice, relative to their differentiated counterparts. The parallel down-regulation of these genes postnatally in response to proliferation and differentiation suggests that the IGN could play a mechanistic role in both cell growth and tissue homeostasis.


Conflict of interest statement

Competing Interests: The authors have declared that no competing interests exist.

Figures

Figure 1
Figure 1. Summary of microarray analysis of imprinted gene expression in hematopoiesis.
Microarray data from mouse LT-HSCs and differentiated lineages were analyzed for the expression of known imprinted genes. The chart (left) shows the distribution of genes according to the specificity of their lineage distribution; the individual genes in each expression category are listed to the right (genes previously identified as being part of the IGN, as defined by Varrault et al. are noted in bold-face type). Supplementary information is provided in Table S1, showing the description of the core IGN genes in this study.
Figure 2
Figure 2. Real-time PCR analysis of imprinted gene expression in hematopoietic cells.
Hematopoietic cell populations were isolated, and the expression of 10 core imprinted genes was determined by Q-RT-PCR. The data representing at least two independently isolated biological replicates for each population are shown as heat maps showing the fold difference in gene expression for each cell type compared to LT-HSCs. (A) Terminally differentiated cell populations (T-cells, B-cells, granulocytes, and erythrocytes) vs. HSCs. (B) Hematopoietic progenitor populations vs. LT-HSCs. (C) LT-HSC expression under conditions of acute (5-FU) or chronic (Lrg47−/−) proliferative stress vs. quiescence. Proliferating LT-HSCs were collected on day 6 post 5-FU treatment or from Lrg47−/− mice, and imprinted gene expression was determined by Q-RT-PCR.
Figure 3
Figure 3. IGN expression is retained in mouse and human somatic stem cell populations but not embryonic stem cells.
The expression of imprinted genes was compared in (A) human bone marrow CD34+ vs. CD34− cells, (B) mouse whole muscle cells during skeletal muscle maturation from P5 to adulthood, (C) quiescent muscle satellite cells (SCs) vs. whole muscle (non-SCs), and (D) mouse skin stem cells vs. keratinocytes (non stem cells). The data representing at least two independently isolated biological replicates for each population are shown in heat maps representing fold differences in expression compared to the reference sample (yellow). Grey shading represents RT-PCR probes that failed to amplify in either population. (E–G) GSEA of gene expression in three of the cell population comparisons is shown in Table 1. Each example shows enrichment for the imprinted gene set, with an FDR q-value ≤5% and an enrichment P-value≤0.03. EB, embryoid bodies; ESC, embryonic stem cells; HFSCs, hair follicle stem cells. Supplementary information is provided in Figure S1, showing the monoallelic expression nature of genes such as Dlk1, Gtl2, H19, Igf2, and Peg3 in mouse HSCs, as well as Table S2, showing the SNPs used for the analysis of monoalleic expression.
Figure 4
Figure 4. Models of IGN during development.
(A) IGN members are highly expressed during embryogenesis but are downregulated in whole tissue as growth proceeds, while their expression is maintained in adult stem cell compartments. (B) Representation effects of the IGN on growth. Maternally expressed genes are depicted in pink and paternally expressed genes in blue. Overall effect on growth as determined by transgenic or knockout animal models is shown in green (promotion) or red (inhibition).

References

    1. Wilson A, Laurenti E, Oser G, van der Wath RC, Blanco-Bose W, et al. Hematopoietic stem cells reversibly switch from dormancy to self-renewal during homeostasis and repair. Cell. 2008;135:1118–1129. - PubMed
    1. Dhawan J, Rando TA. Stem cells in postnatal myogenesis: molecular mechanisms of satellite cell quiescence, activation and replenishment. Trends Cell Biol. 2005;15:666–673. - PubMed
    1. Lavker RM, Sun TT. Epidermal stem cells: properties, markers, and location. Proc Natl Acad Sci U S A. 2000;97:13473–13475. - PMC - PubMed
    1. Barker N, van Es JH, Kuipers J, Kujala P, van den Born M, et al. Identification of stem cells in small intestine and colon by marker gene Lgr5. Nature. 2007;449:1003–1007. - PubMed
    1. Mikkelsen TS, Ku M, Jaffe DB, Issac B, Lieberman E, et al. Genome-wide maps of chromatin state in pluripotent and lineage-committed cells. Nature. 2007;448:553–560. - PMC - PubMed

Publication types