. 2011;6(10):e26707.
doi: 10.1371/journal.pone.0026707. Epub 2011 Oct 21.

CcpA ensures optimal metabolic fitness of Streptococcus pneumoniae

Affiliations

CcpA ensures optimal metabolic fitness of Streptococcus pneumoniae

Sandra M Carvalho et al. PLoS One. 2011.

Abstract

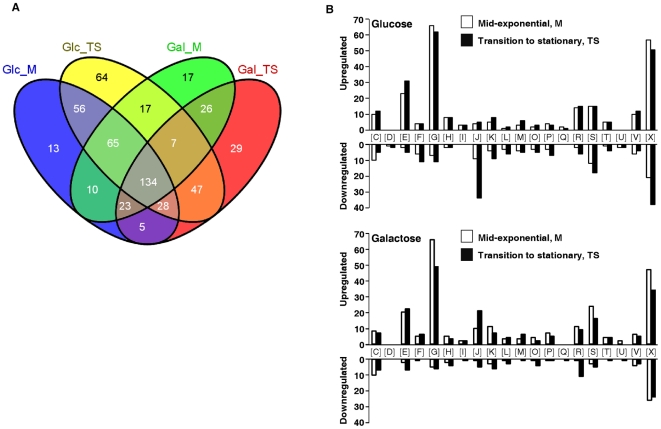
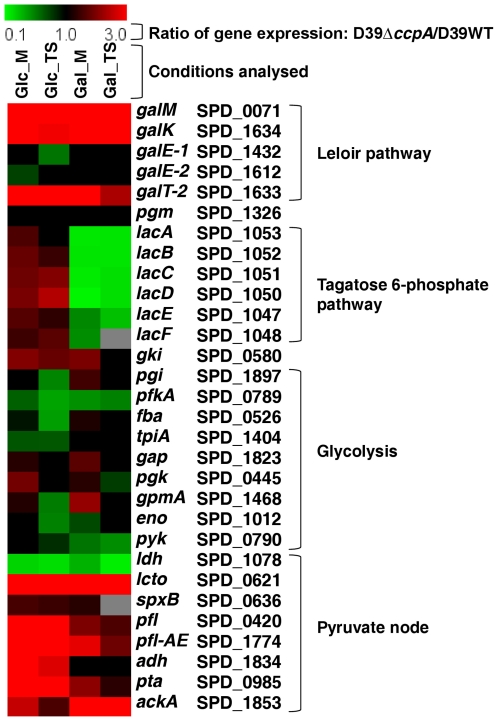
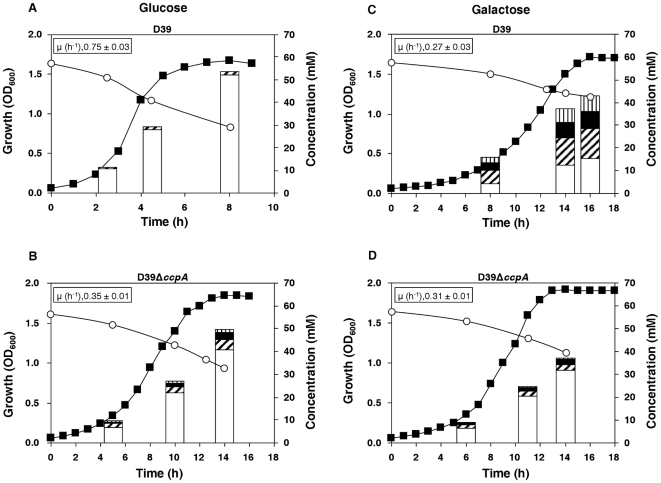
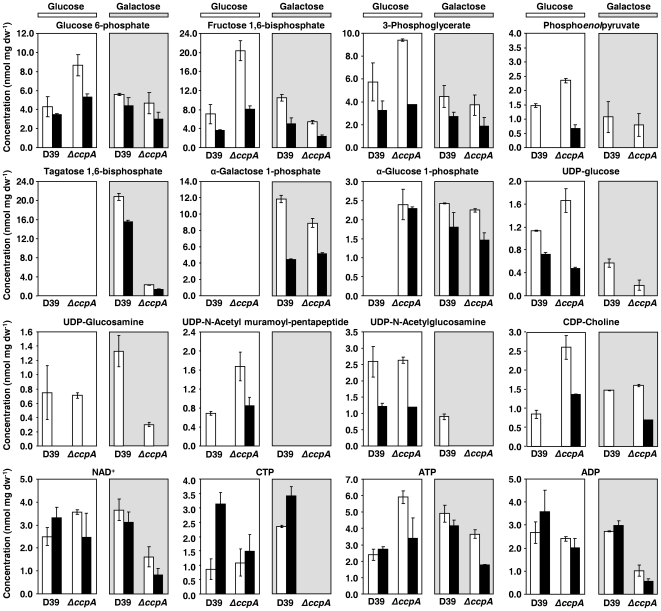
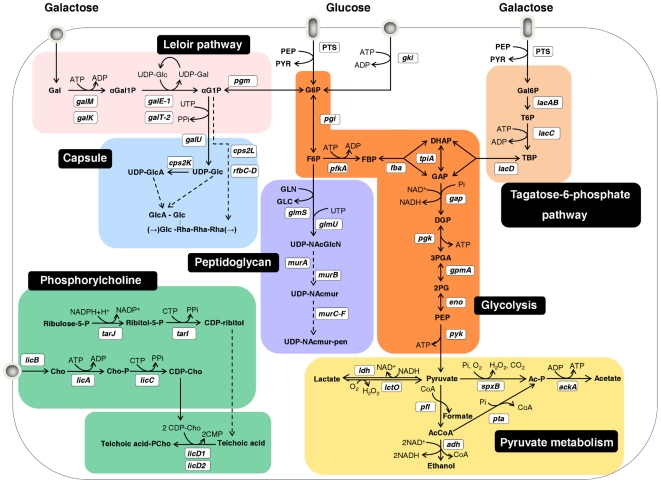
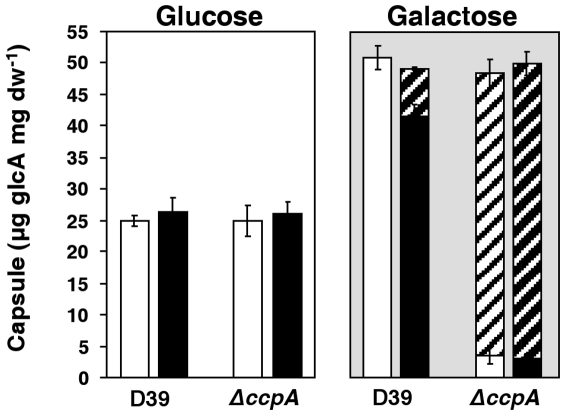
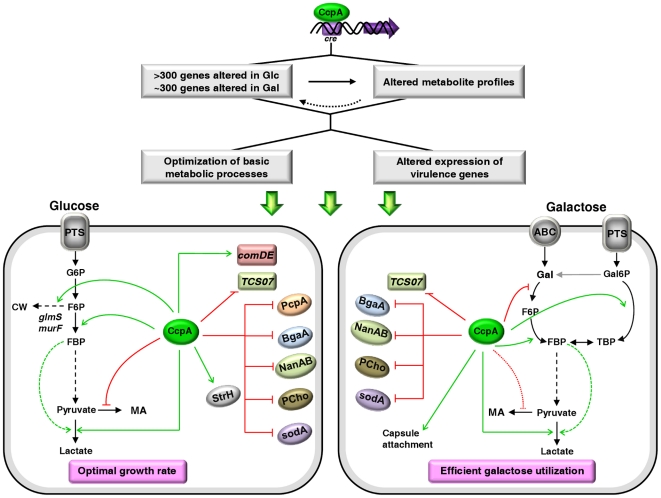
In gram-positive bacteria, the transcriptional regulator CcpA is at the core of catabolite control mechanisms. In the human pathogen Streptococcus pneumoniae, links between CcpA and virulence have been established, but its role as a master regulator in different nutritional environments remains to be elucidated. Thus, we performed whole-transcriptome and metabolic analyses of S. pneumoniae D39 and its isogenic ccpA mutant during growth on glucose or galactose, rapidly and slowly metabolized carbohydrates presumably encountered by the bacterium in different host niches. CcpA affected the expression of up to 19% of the genome covering multiple cellular processes, including virulence, regulatory networks and central metabolism. Its prevalent function as a repressor was observed on glucose, but unexpectedly also on galactose. Carbohydrate-dependent CcpA regulation was also observed, as for the tagatose 6-phosphate pathway genes, which were activated by galactose and repressed by glucose. Metabolite analyses revealed that two pathways for galactose catabolism are functionally active, despite repression of the Leloir genes by CcpA. Surprisingly, galactose-induced mixed-acid fermentation apparently required CcpA, since genes involved in this type of metabolism were mostly under CcpA-repression. These findings indicate that the role of CcpA extends beyond transcriptional regulation, which seemingly is overlaid by other regulatory mechanisms. In agreement, CcpA influenced the level of many intracellular metabolites potentially involved in metabolic regulation. Our data strengthen the view that a true understanding of cell physiology demands thorough analyses at different cellular levels. Moreover, integration of transcriptional and metabolic data uncovered a link between CcpA and the association of surface molecules (e.g. capsule) to the cell wall. Hence, CcpA may play a key role in mediating the interaction of S. pneumoniae with its host. Overall, our results support the hypothesis that S. pneumoniae optimizes basic metabolic processes, likely enhancing in vivo fitness, in a CcpA-mediated manner.


Conflict of interest statement

Competing Interests: The authors have declared that no competing interests exist.

Figures

Figure 1
Figure 1. Genes differentially expressed due to inactivation of CcpA.
A. Venn diagram of the genes significantly differentially transcribed due to loss of CcpA. Transcript levels in D39ΔccpA were compared to D39 wild-type in Glc_M, Gal_M, Glc_TS, Gal_TS as generated by VENNY (http://bioinfogp.cnb.csic.es/tools/venny/index.html). For all intersections, which are not drawn to scale, the numbers of genes are indicated. The total number of genes influenced in each condition tested was: Glc_M, 334 (15.3%), Glc_TS, 418 (19.2%), Gal_M, 299 (13.7%), and Gal_TS 299 (13.7%) in a universe of 2177 genes in the genome of S. pneumoniae. B. Numbers of genes significantly differently transcribed by the ccpA deletion in strain D39 ordered by COG categories. White bars represent M phase of growth, black bars TS phase of growth. [C] Energy production and conversion; [D] Cell cycle control, cell division; chromosome partitioning; [E] Amino acid transport and metabolism; [F] Nucleotide transport and metabolism; [G] Carbohydrate transport and metabolism; [H] Coenzyme transport and metabolism; [I] Lipid transport and metabolism; [J] Translation, ribosomal structure and biogenesis; [K] Transcription; [L] Replication, recombination and repair; [M] Cell wall/membrane/envelope biogenesis; [O] Posttranslational modification, protein turnover, chaperones; [P] Inorganic ion transport and metabolism; [Q] Secondary metabolites biosynthesis, transport and catabolism; [R] General function prediction only; [S] Function unknown; [T] Signal transduction mechanisms; [U] Intracellular trafficking, secretion, and vesicular transport; [V] Defense mechanisms; [X] No prediction. The ratio for each gene is >1.5 or <0.66, but >2 or <0.5 in at least one of the four conditions. The number 2177 represents the total number of amplicons analyzed, covering the entire genome of S. pneumoniae D39. This number is slightly higher than the number of genes in the genome of D39 (2069), since some amplicons were present in versions for different strains (i.e. TIGR4, R6, or D39) or in 2 copies.
Figure 2
Figure 2. Visual representation of the effect of CcpA on the transcription of genes involved in key basic metabolic processes.
Ratio's of genes in glycolysis, the Leloir and tagatose 6-phosphate pathways, and the pyruvate node, in all four conditions analysed in this study (Glc_M, Gal_M, Glc_TS, Gal_TS) are depicted. On top of the figure, a colour scale is given for the ratio of the expression in the ccpA mutant over that in the wild-type strain. Thus, red means repression by CcpA (upregulation in the microarray analysis) and green means activation by CcpA (downregulation in the microarray analysis). For each gene the D39 locus tag and the gene name is given on the right. No cut-off value was applied for the expression ratios of the genes given in the figure. Genes were considered significantly changed when having a Bayesian p-value and FDR meeting the criteria as outlined in the Materials & Methods. Genes that did not meet these criteria were given a ratio of 1.0 (black colour), meaning no significant change in expression. See Fig. 5 for an overview of these pathways in S. pneumoniae D39.
Figure 3
Figure 3. Fermentation profiles of D39 and D39ΔccpA on Glc and Gal.
Growth curves, substrate consumption and end-products formed by the D39 (A and C) and D39ΔccpA (B and D) strains growing on Glc (A and B) or Gal (C and D). Culture supernatant samples for substrate and end product analysis by HPLC and/or 1H-NMR were harvested for each of the conditions in the mid-exponential, transition-to-stationary and growth arrest (maximal biomass) time points of the respective growth curves (bars in the plots). To calculate end-product concentrations, values of at least two independent experiments were averaged and the error was below 7% for major products (>2 mM) and 25% for minor products (<2 mM). Initial concentrations of Glc and Gal were 56±1 mM and 57±1 mM, respectively. Time points in substrate consumption curves are averages of at least two independent experiments and the error is below 5%. Symbols: (○), substrate consumption; (▪), growth curve; white bars, lactate; hatched bars, formate; black bars, acetate; stripped bars, ethanol. Growth curves as in Fig. S1, except that OD600 scale (y-axis) is decimal.
Figure 4
Figure 4. Effect of ccpA deletion on intracellular concentrations of phosphorylated metabolites during growth on Glc or Gal.
Phosphorylated metabolites were measured by 31P-NMR in ethanol extracts of S. pneumoniae D39 and ΔccpA strains grown to mid-exponential (M, white bars, OD600 of 0.35±0.02) or transition-to-stationary phases (TS, black bars, OD600 of 1.3±0.1) of growth in CDM supplemented with 56±1 mM Glc (white background) or 57±1 mM Gal (light grey background). Phosphorylated metabolites measured in extracts comprised glycolytic metabolites, phosphorylated carbohydrate-specific metabolites, UDP-activated metabolites, and co-factors. The values are the mean of three independent experiments ± SD.
Figure 5
Figure 5. Schematic representation of central metabolic pathways in S. pneumoniae D39.
Glc is oxidized to pyruvate via the Embden-Meyerhof-Parnas pathway (Glycolysis, orange box). Homolactic fermentation reduces pyruvate into lactate, whereas mixed-acid fermentation leads to other products, such as formate, acetate and ethanol (Pyruvate metabolism, yellow box). Gal is converted to G6P by the Leloir pathway (light pink box) and to dihydroxyacetone phosphate or glyceraldehyde 3-phosphate by the tagatose 6-phosphate pathway (light orange box). Pathways for capsule, peptidoglycan and phosphorylcholine biosynthesis are shown in light blue, light purple and light green boxes, respectively. Putative and functional characterized genes encoding depicted metabolic steps are shown in white boxes. Proposed pathways were reconstructed based on genome information (http://www.ncbi.nlm.nih.gov/genomes/lproks.cgi), literature and database surveys (KEGG, MetaCyc). Gene annotation downloaded from NCBI: galM, aldose 1-epimerase; galK, galactokinase; galE-1, UDP-glucose 4-epimerase; galT-2, galactose 1-phosphate uridylyltransferase; pgm, phosphoglucomutase/phosphomannomutase family protein; galU, UTP-glucose 1-phosphate uridylyltransferase; cps2L, glucose 1-phosphate thymidylyltransferase; cps2K, UDP-glucose 6-dehydrogenase, putative; rfbC, dTDP-4-dehydrorhamnose 3,5-epimerase, putative; rfbB, dTDP-glucose 4,6-dehydratase; rfbD, dTDP-4-dehydrorhamnose reductase; gki, glucokinase; pgi, glucose 6-phosphate isomerase; pfkA, 6-phosphofructokinase; fba, fructose bisphosphate aldolase; tpiA, triosephosphate isomerase; gap, glyceraldehyde-3-phosphate dehydrogenase; pgk, phosphogltcerate kinase; gpmA, phosphoglyceromutase; eno, phosphopyruvate hydratase; pyk, pyruvate kinase; lacA, galactose 6-phosphate isomerase subunit LacA; lacB, galactose 6-phosphate isomerase subunit LacB; lacC, tagatose 6-phosphate kinase; lacD, tagatose 1,6-diphosphate aldolase; ldh, L-lactate dehydrogenase; lctO, lactate oxidase; spxB, pyruvate oxidase; ackA, acetate kinase; pta, phosphotransacetylase; pfl, pyruvate formate-lyase; adh (spd_1834), bifunctional acetaldehyde-CoA/alcohol dehydrogenase; glmS, D-fructose 6-phosphate amidotransferase; glmU, UDP-N-acetylglucosamine pyrophosphorylase; murA-1 and murA-2, UDP-N-acetylglucosamine 1-carboxyvinyltransferase; murB, UDP-N-acetylenolpyruvoylglucosamine reductase; murC, UDP-N-acetylmuramate-L-alanine ligase; murD, UDP-N-acetylmuramoyl-L-alanyl-D-glutamate synthetase; murE, UDP-N-acetylmuramoylalanyl-D-glutamate-2,6-diaminopimelate ligase; murF, UDP-N-acetylmuramoylalanyl-D-glutamyl-2, 6-diaminopimelate–D-alanyl-D-alanyl ligase; tarJ (spd_1126), alcohol dehydrogenase, zinc-containing or TarJ; tarI (spd_1127), 2-C-methyl-D-erythritol 4-phosphate cytidylyltransferase or TarI; licB, protein LicB; pck, choline kinase or LicA; licC, CTP:phosphocholine cytidylyltransferase; LicD1, phosphotransferase LicD1; LicD2, phosphotransferase LicD2.
Figure 6
Figure 6. Amount of capsule polysaccharide in D39 and its isogenic ccpA mutant.
Estimation of capsule was performed based on the determination of its glucuronic acid content in strains D39 and D39ΔccpA in mid-exponential (white bars, OD600 of 0.35±0.02) and transition-to-stationary (black bars, OD600 of 1.3±0.1) cultures grown in CDM containing 56±1 mM Glc (white background) or 57±1 mM Gal (light grey background). Hatched bars indicate loose capsule polysaccharide. All the determinations were done twice in two independent cultures and the values are means ± SD.
Figure 7
Figure 7. Model for CcpA regulation of basic metabolic processes and virulence factor expression in the presence of Glc or Gal in S. pneumoniae.
Transport of carbohydrates through the multi-protein phosphoenolpyruvate phosphotransferase system (PTS) ensures a typical PTS-mediated signal transduction pathway for CcpA regulation. CcpA-mediated regulation results in altered expression of genes involved in carbohydrate metabolism and classical virulence factors, including cell wall associated proteins, transcriptional regulators and phosphorylcholine. Repression and activation are represented by red and green arrows, respectively. Dashed lines indicate metabolic regulation. G6P, Glucose 6-phosphate; F6P, fructose 6-phosphate; CW, cell wall; MA, mixed-acid fermentation; PcpA, choline binding protein PcpA; BgaA, beta-galactosidaseA; NanAB, neuraminidases A and B; PCho, Phosphorylcholine; SodA, superoxide dismutase, manganese-dependent; StrH, β-N-acetylhexosaminidase; TCS07 and ComDE, two-component systems.

References

    1. Mitchell TJ. The pathogenesis of streptococcal infections: from tooth decay to meningitis. Nat Rev Microbiol. 2003;1:219–230. - PubMed
    1. Kadioglu A, Weiser JN, Paton JC, Andrew PW. The role of Streptococcus pneumoniae virulence factors in host respiratory colonization and disease. Nat Rev Microbiol. 2008;6:288–301. - PubMed
    1. Deutscher J, Francke C, Postma PW. How phosphotransferase system-related protein phosphorylation regulates carbohydrate metabolism in bacteria. Microbiol Mol Biol Rev. 2006;70:939–1031. - PMC - PubMed
    1. Görke B, Stülke J. Carbon catabolite repression in bacteria: many ways to make the most out of nutrients. Nat Rev Microbiol. 2008;6:613–624. - PubMed
    1. Lulko AT, Buist G, Kok J, Kuipers OP. Transcriptome analysis of temporal regulation of carbon metabolism by CcpA in Bacillus subtilis reveals additional target genes. J Mol Microbiol Biotechnol. 2007;12:82–95. - PubMed

Publication types