. 2011 Oct 31:10:329.
doi: 10.1186/1475-2875-10-329.

Sexual recombination is a signature of a persisting malaria epidemic in Peru

Affiliations

Sexual recombination is a signature of a persisting malaria epidemic in Peru

Patrick L Sutton et al. Malar J. .

Abstract

Background: The aim of this study was to consider the impact that multi-clone, complex infections have on a parasite population structure in a low transmission setting. In general, complexity of infection (minimum number of clones within an infection) and the overall population level diversity is expected to be minimal in low transmission settings. Additionally, the parasite population structure is predicted to be clonal, rather than sexual due to infrequent parasite inoculation and lack of recombination between genetically distinct clones. However, in this low transmission of the Peruvian Amazon, complex infections are becoming more frequent, in spite of decreasing infection prevalence. In this study, it was hypothesized that sexual recombination between distinct clonal lineages of Plasmodium falciparum parasites were altering the subpopulation structure and effectively maintaining the population-level diversity.

Methods: Fourteen microsatellite markers were chosen to describe the genetic diversity in 313 naturally occurring P. falciparum infections from Peruvian Amazon. The population and subpopulation structure was characterized by measuring: clusteredness, expected heterozygosity (He), allelic richness, private allelic richness, and linkage disequilibrium. Next, microsatellite haplotypes and alleles were correlated with P. falciparum merozoite surface protein 1 Block 2 (Pfmsp1-B2) to examine the presence of recombinant microsatellite haplotypes.

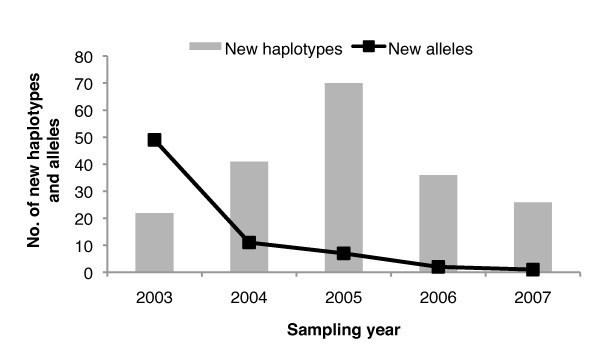
Results: The parasite population structure consists of six genetically diverse subpopulations of clones, called "clusters". Clusters 1, 3, 4, and 6 have unique haplotypes that exceed 70% of the total number of clones within each cluster, while Clusters 2 and 5 have a lower proportion of unique haplotypes, but still exceed 46%. By measuring the He, allelic richness, and private allelic richness within each of the six subpopulations, relatively low levels of genetic diversity within each subpopulation (except Cluster 4) are observed. This indicated that the number of alleles, and not the combination of alleles, are limited. Next, the standard index of association (IAS) was measured, which revealed a significant decay in linkage disequilibrium (LD) associated with Cluster 6, which is indicative of independent assortment of alleles. This decay in LD is a signature of this subpopulation approaching linkage equilibrium by undergoing sexual recombination. To trace possible recombination events, the two most frequent microsatellite haplotypes observed over time (defined by either a K1 or Mad20) were selected as the progenitors and then potential recombinants were identified in within the natural population.

Conclusions: Contrary to conventional low transmission models, this study provides evidence of a parasite population structure that is superficially defined by a clonal backbone. Sexual recombination does occur and even arguably is responsible for maintaining the substructure of this population.


Figures

Figure 1
Figure 1
Plasmodium falciparum infection prevalence and frequency of complex infections over time. Despite the declining infection prevalence over time (black line), the proportion of complex to single-clone infections increases (red, dotted line).
Figure 2
Figure 2
Distribution of Pfmsp1-B2 allelic families over time. Despite a shift in the dominant allelic families circulating in the population, the increased proportion of complex to single-clone infections is attributable to complex infections containing both Mad20 and K1 clonal variants.
Figure 3
Figure 3
Minimum Spanning Network (MSN) with cluster analysis superimposed. The Clusters are differentiated by colors: orange = C1, light blue = C2, purple = C3, green = C4, red = C5, and dark blue = C6. Black dots are constituents of complex infections and red dots are putative progenitors. Figure backbone is the MSN with cluster-colored circles representing individual infections. Circle size is proportionate to the number of infections with the same MS haplotype. Cluster-colored clouds superimposed on the MSN are indicative of cluster-grouping. Distance between circles is indicative of the number loci polymorphisms.
Figure 4
Figure 4
Frequency of new alleles and haplotypes over time. The sampling epoch (2003-2007) is indicated on the x-axis, number of new haplotypes on the primary y-axis, and number of new alleles on the secondary y-axis. The detection of new haplotypes over time was not due to the detection of new alleles over time. In fact, > 65% of all of the alleles detected across all five years of this study were detected in 2003, the first year of this study.
Figure 5
Figure 5
Examples of observed progenitors and recombined microsatellite haplotypes. A) Correlation of Pfmsp1-B2 allelic families with individual microsatellite alleles in the population. Each microsatellite locus is identified on the horizontal, while the correlated Pfmsp1-Block 2 main allelic family is indicated on the vertical. Letters under each microsatellite locus are indicative of individual alleles (repeat-lengths) ordered sequentially by frequency within the population. Colored blocks are used to indicate a correlation with a specific Pfmsp1-Block 2 main allelic family and are identified in the legend. B) Examples of potential recombinants between two single-clone lineages. Illustrates the two most frequent single-clone infections that may have given rise to these six examples of complex infections (shown on the inlay) haplotypes by genomic shuffling (putative progenitor clones).
Figure 6
Figure 6
Model illustrating the clonal backbone of single-clone infections (A) and homogenization between constituents of complex infections (B). Each vertical column of circles represents a specific microsatellite locus (seven total for both A and B) and the number of independent circles within each vertical column represents the number of alleles detected within that particular locus. Blue and yellow coloring is indicative of a correlation with either Mad20 (blue) or K1 (yellow) Pfmsp1-Block2 main allelic families, respectively. The size of the colored circles represents the number of infections indentified by a particular allele that was associated with either Mad20 or K1. When circles are superimposed, this shows that alleles were correlated (with varying proportions based on circle-size) to both Mad20 and K1. Lines between loci indicate the number of instances (differentiated by the line thickness) that one allele paired with another allele in the population. A) Illustrates the clonal backbone present within single-clone infections, indicated by having a predominantly blue (Mad20) clonal family and a predominately yellow (K1) clonal family. This is further supported by a fewer number of lines between loci pairs and predominantly clonal haplotypes. B) Illustrates a breakdown in linkage between loci pairs, with an increased number of loci pairs and a relatively equal distribution of clones correlated to each Pfmsp1-B2 main allelic family causing the disappearance of the clonal backbone.

References

    1. Anderson TJC, Haubold B, Williams JT, Estrada-Franco JG, Richardson L, Mollinedo R, Bockarie M, Mokili J, Mharakurwa S, French N, Whitworth J, Velez ID, Brockman AH, Nosten F, Ferreira MU, Day KP. Microsatellite markers reveal a spectrum of population structures in the malaria parasite Plasmodium falciparum. Mol Biol Evol. 2000;17:1467–1482. - PubMed
    1. Barker GC. Microsatellite DNA: a tool for population genetic analysis. Trans R Soc Trop Med Hyg. 2002;96:S21–S24. - PubMed
    1. Su X-Z, Wellems TE. Toward a high-resolution Plasmodium falciparum linkage map: polymorphic markers from hundreds of simple sequence repeats. Genomics. 1996;33:430–444. doi: 10.1006/geno.1996.0218. - DOI - PubMed
    1. Havryliuk T, Ferreira MU. A closer look at multiple-clone Plasmodium vivax infections: detection methods, prevalence and consequences. Mem Inst Oswaldo Cruz. 2009;104:67–73. - PubMed
    1. Imwong M, Sudimack D, Pukrittayakamee S, Osorio L, Carlton JM, Day NP, White NJ, Anderson TJ. Microsatellite variation, repeat array length, and population history of Plasmodium vivax. Mol Biol Evol. 2006;23:1016–1018. doi: 10.1093/molbev/msj116. - DOI - PubMed

Publication types