. 2011 Dec;82(6):1454-67.
doi: 10.1111/j.1365-2958.2011.07904.x. Epub 2011 Nov 21.

Ubiquitin and ubiquitin-modified proteins activate the Pseudomonas aeruginosa T3SS cytotoxin, ExoU

Affiliations

Ubiquitin and ubiquitin-modified proteins activate the Pseudomonas aeruginosa T3SS cytotoxin, ExoU

David M Anderson et al. Mol Microbiol. 2011 Dec.

Abstract

Pseudomonas aeruginosa is an opportunistic Gram-negative pathogen that possesses a type III secretion system (T3SS) critical for evading innate immunity and establishing acute infections in compromised patients. Our research has focused on the structure-activity relationships of ExoU, the most toxic and destructive type III effector produced by P. aeruginosa. ExoU possesses phospholipase activity, which is detectable in vitro only when a eukaryotic cofactor is provided with membrane substrates. We report here that a subpopulation of ubiquitylated yeast SOD1 and other ubiquitylated mammalian proteins activate ExoU. Phospholipase activity was detected using purified ubiquitin of various chain lengths and linkage types; however, free monoubiquitin is sufficient in a genetically engineered dual expression system. The use of ubiquitin by a bacterial enzyme as an activator is unprecedented and represents a new aspect in the manipulation of the eukaryotic ubiquitin system to facilitate bacterial replication and dissemination.


Figures

Fig. 1
Fig. 1. Peptides from a liver bSOD1 preparation activate ExoU in vitro
A. 10–20% Tris-tricine Coomassie-stained SDS-PAGE gel showing peptides generated using alkylated liver bSOD1. Lanes 1, 6 and 12 are molecular weight standards; Lane 2, undigested bSOD1; Lane 3, endoproteinase Lys-C (Lys-C) only; Lane 4, Lys-C digestion; Lane 5, Lys-C and thrombin only; Lane 7, Lys-C + thrombin digestion; Lane 8, Lys-C and glutamyl endopeptidase (Glu-C) only; Lane 9, Lys-C + Glu-C digestion; Lane 10, Lys-C, Glu-C and thrombin only; Lane 11, Lys-C + Glu-C + thrombin digested bSOD1. Arrows indicate a peptide that is present in undigested SOD1 and retained in SOD1 digested to completion with endoproteinase Lys-C, thrombin and glutamyl endopeptidase as outlined. B. Activity assay using either untreated bSOD1, sequentially and completely digested protein or a protease only control as cofactor material. “Triple Digestion” corresponds to lane 11 in (A). C. Western blot analysis of bSOD1 from a 1:1000 proteinase K: bSOD1 (w/w) digestion over a 120 min time course. Anti-SOD1 (1:5000) was used as the primary antibody in this analysis. D. Specific phospholipase activity (nmol PED6 cleaved/min/mg rExoU) when proteinase K digested products from denatured bSOD1 are used to activate rExoU over a digestion time course (error bars ± SEM, n = 3). Untreated refers to bSOD1 that is not denatured nor protease treated and undigested refers to bSOD1 that is denatured but not treated with proteinase K.
Fig. 2
Fig. 2. Ubiquitylated proteins activate ExoU
A. Histidine tagged recombinant ySOD1 was purified and subjected to a 2-fold dilution series followed by SDS-polyacrylamide gel electrophoresis and Western blot analysis. The beginning protein concentration for each blot was 4 μg of purified ySOD1. Left panel, Western blot of ySOD1 titration probed with antibody to the histidine tag. Right panel, Western blot analysis identical to the left panel except probed with monoclonal antibody specific for ubiquitin. Equivalent amounts of primary antibody were used for each blot. Two-fold more secondary antibody was used to detect the anti-ubiquitin probe. Exposure times: anti-His, 3 sec; anti-ubiquitin, 1 h. B. Western blot analysis of ubiquitylated proteins from U2OS cells. Left panel, cultures were subjected to an 8 h treatment with MG132 (10 μM, + lanes) or medium only (− lanes) before harvest. Five percent of each cell lysate (~ 5.0 × 10⁵ cells) was probed with anti-ubiquitin or antibody to GAPDH (loading control) after electrophoresis (SDS-PAGE, 15%) and Western blot transfer. Right panel, the remaining portion of each corresponding lysate was subjected to immunoprecipitation with an isotype control or anti-ubiquitin monoclonal antibody and probed in Western blot analysis of an SDS-PAGE (8% gel) with anti-ubiquitin. Bottom right panel, SDS-PAGE gel (15%) of isotype control or anti-ubiquitin precipitated material probed with anti-ubiquitin. Free or monoubiquitin is not detectable. A two-fold monoubiquitin titration (100 – 1.5 ng) was loaded to lanes on the same gel to establish the detection range of the antibody. C. In vitro assay measuring cleavage of a phospholipid mimic, PED6, using identical amounts of protein shown in each lane for material immunoprecipitated with anti-ubiquitin or isotype control antibodies. Assay measurements from equivalent amounts of each antibody bound to Protein G beads exposed to lysis buffer only were subtracted as background. Data are expressed as means ± SEM, n = 3.
Fig. 3
Fig. 3. Multiple isoforms of ubiquitin activate rExoU
A. Michaelis-Menten plots representing in vitro phospholipase activity measured from titrations of several ubiquitin species. Nanomoles PED6 cleaved were calculated from steady state rates of RFU accumulation. Dashed lines represent non-linear regression fit of data. The inset graph for each ubiquitin species is the double reciprocal plot with linear regression analysis designated as the dashed line. B. The bar graph shows the affinity of ExoU for different ubiquitin isoforms plotted in terms of 1/Kact and chain length (the mean ± SEM, *p < 0.01).
Fig. 4
Fig. 4. Recombinant ExoU binds immobilized ubiquitin
A. The binding of rExoU to immobilized monoubiquitin was determined using a solid-phase binding assay (Schmalzer et al., 2010 and Methods). rExoU binding was detected using monoclonal antibody and a fluorescent horse radish peroxidase conjugated secondary reagent. The data are plotted and analyzed by non-linear regression (dashed line). Each point represents three independent experiments. The closed circles (λ) represent histidine-tagged rExoU and the closed squares (ν) represent the negative control protein, histidine-tagged rPcrV. The inset graph is the double reciprocal plot with linear regression analysis designated as the dashed line. B. Solid phase binding assay using immobilized K48-linked polyubiquitin. C. Bar graph shows comparison in affinity (1/Kd) of monoubiquitin versus polyubiquitin chains. Data are expressed as the mean ± SEM, n = 3. *p < 0.01.
Fig. 5
Fig. 5. Co-expression of ExoU and ubiquitin in E. coli is lethal
A. Western blot analysis of the independent or simultaneous expression of PcrV and ubiquitin within E. coli cells transformed with two expression plasmids. The expression of monoubiquitin is induced by the addition of IPTG and the expression of PcrV is induced by the addition of arabinose to the medium. Each lane is labeled by the number of hours post induction that the sample was harvested for analysis. B. Western blot analysis of the independent or simultaneous expression of ExoU and monoubiquitin within E. coli cells transformed with similar expression plasmids as described in panel A. C. Cells harboring inducible ExoU or PcrV and ubiquitin vectors were measured for cell survival after dual expression of both constructs over a 3 h time course. Error bars are means ± SEM (n = 3). D. Relative survival of each strain at each time point over the induction period in relation to cell number at time zero induction. Error bars are means ± SEM (n = 3), *p < 0.0001. E. Lysates were made using cells harvested from the 3 h time point and one OD600 unit was analyzed for PED6 cleavage in vitro. Error bars are for the mean ± SEM (n = 3).
Fig. 6
Fig. 6. Morphological changes in E. coli cells after induction of ExoU and monoubiquitin
A. Bacterial cells were induced for expression of ExoU or PcrV with ubiquitin for the indicated times. Cells were stained with a lipophilic dye FM4-64, washed, and detected by using a filter for FM4-64 or differential interference contrast (DIC). Arrows indicate morphology changes. B. The co-expression cells were induced for 90 min and stained with nucleic acid stains SYTOX green (membrane impermeable) and permeable Hoechst 33342 (blue) in the presence of FM4-64 (red). Cells were incubated on poly-lysine coated glass coverslips and washed to remove unbound cells prior to image acquisition. Scale bars in overlay images indicate 2 μm.
Fig. 7
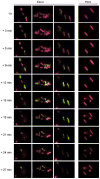
Fig. 7. Time-lapse imaging of the co-expression E. coli strains during induction
Bacterial cells were induced for the expression of ExoU or PcrV with monoubiquitin and stained with SYTOX green, Hoechst 33342 (blue) and FM4-64 (red) in the presence of inducers in a glass-bottom dish. After 1h-post induction, cells were analyzed at 30°C by time-lapse microscopy. Images were acquired with 10 steps of a 3 min interval as indicated.

References

    1. Angot A, Vergunst A, Genin S, Peeters N. Exploitation of eukaryotic ubiquitin signaling pathways by effectors translocated by bacterial type III and type IV secretion systems. PLoS Pathogens. 2007;3:e3. - PMC - PubMed
    1. Baboshina OV, Haas AL. Novel multiubiquitin chain linkages catalyzed by the conjugating enzymes E2EPF and RAD6 are recognized by 26 S proteasome subunit 5. J Biol Chem. 1996;271:2823–2831. - PubMed
    1. Benson MA, Komas SM, Schmalzer KM, Casey MS, Frank DW, Feix JB. Induced conformational changes in the activation of the Pseudomonas aeruginosa type III toxin, ExoU. Biophys J. 2011;100:1335–1343. - PMC - PubMed
    1. Benson MA, Schmalzer KM, Frank DW. A sensitive fluorescence-based assay for the detection of ExoU-mediated PLA2 activity. Clinica Chima Acta. 2010;411:190–197. - PMC - PubMed
    1. Bohnsack RN, Haas AL. Conservation in the mechanism of Nedd8 activation by the human AppBp1-Uba3 heterodimer. J Biol Chem. 2003;278:26823–26830. - PubMed

Publication types