. 2011 Oct 31;195(3):403-15.
doi: 10.1083/jcb.201105063.

Selective repression of MEF2 activity by PKA-dependent proteolysis of HDAC4

Affiliations

Selective repression of MEF2 activity by PKA-dependent proteolysis of HDAC4

Johannes Backs et al. J Cell Biol. .

Abstract

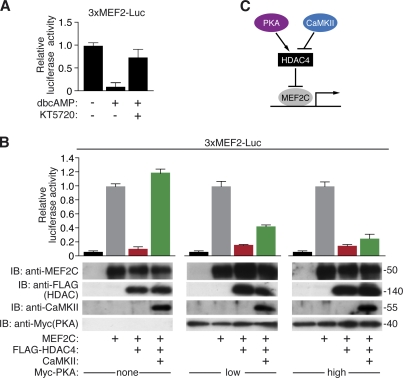
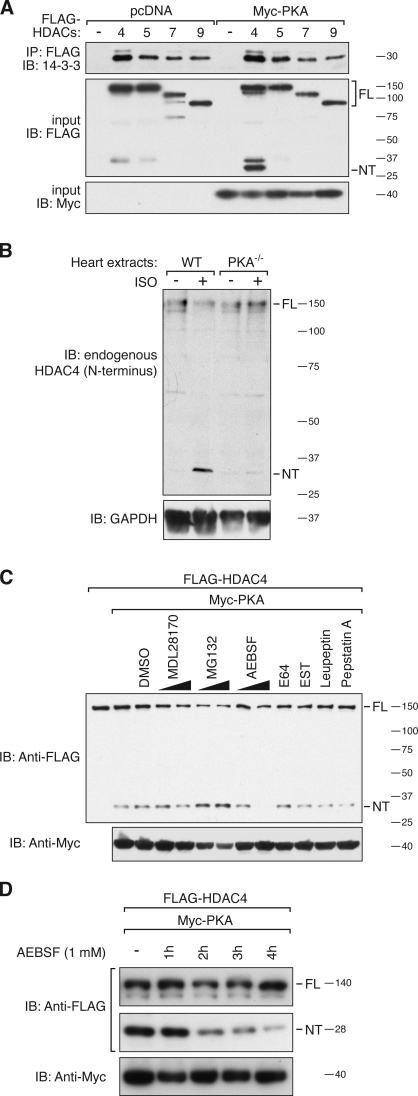
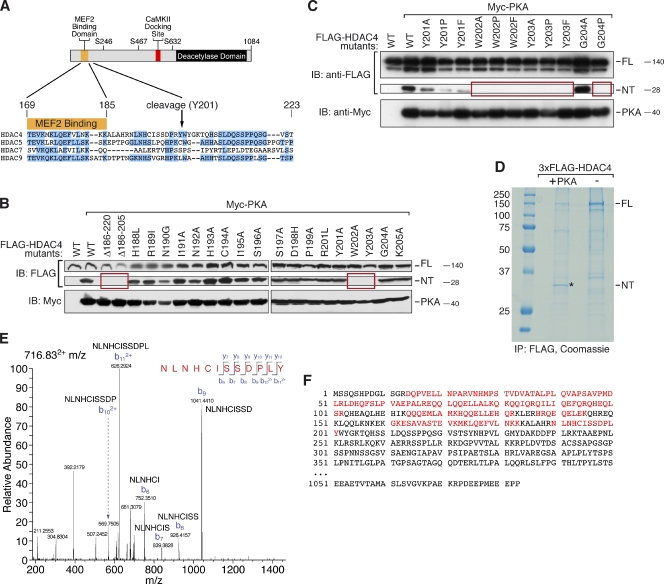
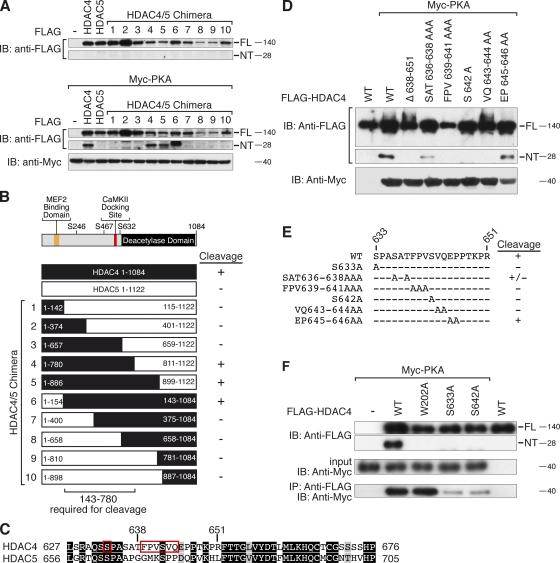
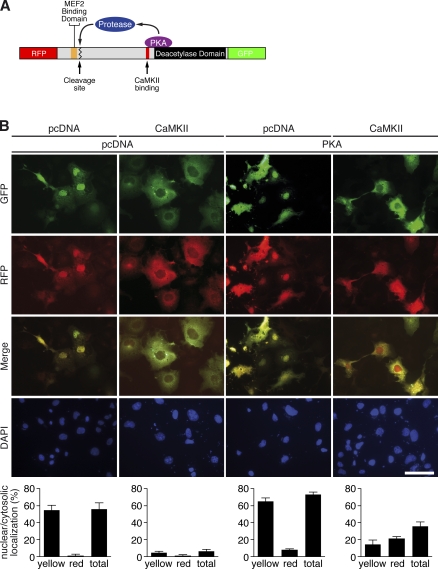
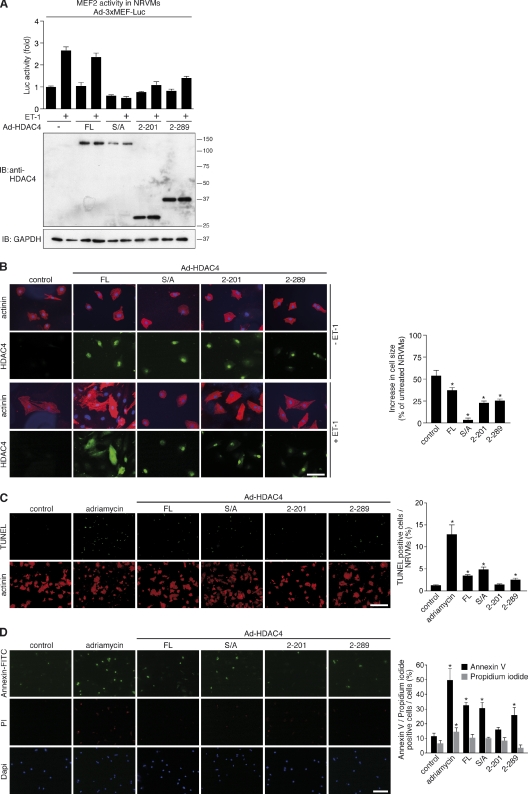
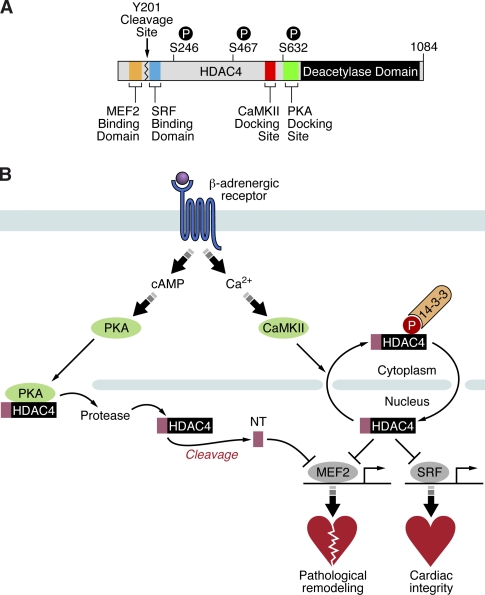
Histone deacetylase 4 (HDAC4) regulates numerous gene expression programs through its signal-dependent repression of myocyte enhancer factor 2 (MEF2) and serum response factor (SRF) transcription factors. In cardiomyocytes, calcium/calmodulin-dependent protein kinase II (CaMKII) signaling promotes hypertrophy and pathological remodeling, at least in part by phosphorylating HDAC4, with consequent stimulation of MEF2 activity. In this paper, we describe a novel mechanism whereby protein kinase A (PKA) overcomes CaMKII-mediated activation of MEF2 by regulated proteolysis of HDAC4. PKA induces the generation of an N-terminal HDAC4 cleavage product (HDAC4-NT). HDAC4-NT selectively inhibits activity of MEF2 but not SRF, thereby antagonizing the prohypertrophic actions of CaMKII signaling without affecting cardiomyocyte survival. Thus, HDAC4 functions as a molecular nexus for the antagonistic actions of the CaMKII and PKA pathways. These findings have implications for understanding the molecular basis of cardioprotection and other cellular processes in which CaMKII and PKA exert opposing effects.


Figures

Figure 1.
Figure 1.
PKA represses MEF2 activity. (A) H9c2 myocytes were transfected with the 3×MEF2-Luc reporter and stimulated with 1 mM dbcAMP in the absence or presence of the PKA inhibitor KT5720 (2 µM). Firefly luciferase was normalized to renilla luciferase expression (driven by a cytomegalovirus promoter). The experiment was performed in triplicates. Similar results were obtained in three different experiments. (B) COS cells were transfected with the 3×MEF-Luc reporter and expression plasmids encoding 100 ng MEF2C, 10 ng FLAG-HDAC4, and 100 ng CaMKII in the absence and presence of low (25 ng) or high (50 ng) amounts of Myc-PKA expression plasmid, as indicated. Firefly luciferase was normalized to renilla luciferase expression. Western blots showing expression of MEF2C, FLAG-HDAC4, CaMKII, and Myc-PKA in the same sample as used for the reporter assay are shown below the reporter assay quantification. IB, immunoblot. Molecular mass is indicated in kilodaltons. The experiment was performed in duplicates. Similar results were obtained in three different experiments. (A and B) Error bars indicate ± SEM. (C) A model showing antagonistic effects of PKA and CaMKII on HDAC4 and MEF2 activity.
Figure 2.
Figure 2.
PKA-dependent proteolysis of HDAC4. (A) Coimmunoprecipitation assay with lysates from COS cells expressing FLAG-HDAC4, -HDAC5, -HDAC7, and -HDAC9 (MEF2-interacting transcription repressor). Extracts were immunoprecipitated (IP) with anti-FLAG antibody and immunoblotted (IB) with an antibody directed against endogenous 14-3-3 protein (top). The effect of Myc-PKA was tested. Input proteins were detected with antibodies directed against FLAG and Myc, identifying an N-terminal FLAG-HDAC4 cleavage product (NT) of ∼28 kD. (B) Western blot analysis of cardiac extracts from WT and Prkaca knockout (PKA−/−) mice that were treated for 4 h with or without Iso (60-µg/g body weight, 15 µg/g per hour). The membrane was analyzed with an antibody directed against the N terminus of HDAC4 (N-18). Glyceraldehyde 3-phosphate dehydrogenase (GAPDH) was detected as a loading control. (C and D) COS cells were transfected with FLAG-HDAC4 and Myc-PKA. HDAC4-FL and -NT were detected by Western blot analysis using an antibody directed against FLAG. The effects of inhibitors of calpains (5 and 20 µM MDL28170 and 50 µM EST), the proteasome (10 and 25 µM MG132), cysteine proteases (10 µM E64 and 100 µM leupeptin), aspartic proteases (10 µM pepstatin A), and serine proteases (100 and 400 µM AEBSF) on HDAC4-NT production (C) and different treatment periods of AEBSF to determine the half-life of posttranslationally produced HDAC4-NT (D) are shown. Molecular mass is indicated in kilodaltons.
Figure 3.
Figure 3.
Identification of the HDAC4 cleavage site. (A) A schematic of the HDAC4 protein and the amino acid sequence surrounding Tyr201. The sequence of this HDAC4 domain is aligned with other HDACs. The cleavage site lies 15 amino acids after the MEF2-binding domain in a unique region of HDAC4. Conserved amino acids are highlighted in blue. (B and C) Western blot analysis of lysates from COS cells expressing FLAG-HDAC4-WT and different FLAG-HDAC4 mutants (as indicated) together with Myc-PKA. HDAC4-FL and -NT expression was detected with an antibody directed against FLAG and PKA expression with an antibody directed against Myc. Mutants that fail to be cleaved are boxed in red. IB, immunoblot. (D) An anti-FLAG immunoprecipitate (IP) of lysates of COS cells that expressed 3×FLAG-HDAC4 with and without PKA was analyzed by SDS-PAGE and Coomassie staining. HDAC4-NT (marked with an asterisk in the PKA lane) was identified based on its sole production in the presence of PKA. This band was excised from the gel, and tryptic peptides were analyzed. (E and F) MS analysis of the most C-terminal peptide obtained by tryptic digestion of immunoprecipitated HDAC4-NT (R200L) is shown (E). All HDAC4 peptides that were identified are marked in red (F). Molecular mass is indicated in kilodaltons.
Figure 4.
Figure 4.
Identification of a PKA-binding domain on HDAC4. (A and B) FLAG-HDAC4, -HDAC5, and -HDAC4/5 chimeric proteins (as indicated in B) were expressed in COS cells in the presence and absence of Myc-PKA. Expression of FLAG-tagged HDAC4-FL and -NT was detected by Western blot analysis using an antibody directed against FLAG. The schematic (B) summarizes the WT and mutant HDACs that were cleaved. IB, immunoblot. (C and D) Mutational analysis of a unique domain of HDAC4. As indicated in D, PKA was expressed with HDAC4 mutants, in which this domain was deleted or single amino acids were replaced by an alanine. HDAC4-FL and -NT production were detected by Western blot analysis. The amino acids of HDAC4 that were found to be required for HDAC4-NT production are framed in red, and conserved amino acids are highlighted by black (identical residues) and gray (similar residues) boxes (C). (E) Summary of essential amino acids within the central part of HDAC4 required for HDAC4-NT production. The region between amino acid 639 and 644 is required for PKA responsiveness. (F) Coimmunoprecipitation assay with lysates from COS cells expressing FLAG-HDAC4, the indicated FLAG-HDAC4 mutants, and Myc-PKA. Extracts were immunoprecipitated with anti-FLAG antibody and blotted with an antibody directed against Myc. Input proteins were detected with antibodies directed against FLAG and Myc. These data show that Ser633 and Ser642 are required not only for HDAC4-NT production but also for PKA binding. As a control, mutation of the cleavage site (W202A) prevented only HDAC4-NT production but not PKA binding. Molecular mass is indicated in kilodaltons.
Figure 5.
Figure 5.
HDAC4-NT localizes to the nucleus. (A) RFP-HDAC4-GFP was coexpressed with CaMKII, PKA, or both in COS cells. A schematic of the RFP-HDAC4-GFP fusion is shown. (B) Subcellular localization of RFP-HDAC4-GFP in the green and red fluorescence channels is shown. To assess localization of HDAC4-FL versus HDAC4-NT, both channels were merged, identifying red nuclei as a sign for nuclear accumulation of HDAC4-NT. Nuclei are visualized by DAPI staining. The quantitative analysis is shown below the representative images. More than 100 cells per condition were analyzed in three selected fields. The ratio per field was quantified (n = 3). Bar, 25 µm.
Figure 6.
Figure 6.
MEF2-selective effects of HDAC4-NT in cardiomyocytes. (A) A pull-down assay with GST or GST-MEF2C and a lysate of COS cells expressing FLAG-HDAC4 and PKA. An anti-FLAG Western blot analysis of the COS cell lysate input and the pull-down experiment is shown. IB, immunoblot. (B) Coimmunoprecipitation assay with lysates from COS cells coexpressing FLAG-tagged HDAC4-FL (in the absence and presence of PKA) or HDAC4-NT and Myc-MEF2C. The immunoprecipitate (IP) was analyzed with an antibody directed against Myc. Input proteins were detected with antibodies directed against FLAG and Myc. These data show that both HDAC4-FL and -NT bind to MEF2C. (C) COS cells were transfected with the 3×MEF-Luc reporter and expression plasmids encoding MEF2C and FLAG-tagged HDAC4-FL, HDAC4-NT, or HDAC5, as indicated. Firefly luciferase activity was normalized to renilla luciferase expression (driven by a cytomegalovirus promoter). Western blots showing expression of FLAG-HDACs and MEF2C in the same sample used for reporter assay are shown below the reporter assay quantification. (D) Coimmunoprecipitation assay with lysates from COS cells expressing FLAG-tagged HDAC4-FL, HDAC4 2–289, and HDAC4 2–201 (NT) together with SRF. The FLAG immunoprecipitate was blotted with an antibody directed against SRF. Input proteins were detected with antibodies directed against SRF and FLAG. These data show that HDAC4-FL and HDAC4 2–289 bind strongly to SRF, but HDAC4 2–201 (NT) does not. (E and F) COS cells were cotransfected with the 4×CARG-Luc reporter and expression plasmids encoding SRF and FLAG-tagged HDAC4-FL, HDAC4-NT (2–201), HDAC5, or HDAC4 2–289, as indicated. Western blots showing expression of FLAG-HDACs and SRF in the same sample used for reporter assay are shown below the reporter assay quantification. Molecular mass is indicated in kilodaltons. (C, E, and F) The experiments were performed in duplicates. Similar results were obtained in three different experiments. (G) A schematic showing the selective interaction and repression of MEF2 by HDAC4-NT.
Figure 7.
Figure 7.
HDAC4-NT affects cardiomyocyte hypertrophy but not viability. (A) A luciferase reporter assay in NRVMs that were transduced with adenoviruses (Ad) for 3×MEF2-Luc and HDAC4-FL and mutants, as indicated. Ad–3×MEF2-Luc was cotransduced with adenoviruses encoding the indicated forms of HDAC4 in the presence of 100 nM ET-1. Firefly luciferase expression was normalized to the protein content of each sample. HDAC expression in the same preparation as used for reporter assays was detected using an antibody directed against the N terminus of HDAC4 (N-18) and is shown below the reporter assay quantification. GAPDH, glyceraldehyde 3-phosphate dehydrogenase; IB, immunoblot. Molecular mass is indicated in kilodaltons. (B) Immunocytochemistry of NRVMs transduced with Ad–HDAC4-FL, -S/A, 2–201 (NT), or 2–289 using antibodies recognizing sarcomeric α-actinin (red; top) to assess myocyte size and sarcomere organization and FLAG (green; bottom) to determine the subcellular localization of HDAC4-FL and mutants. DAPI staining was used to label nuclei. NRVMs are shown under baseline conditions or after treatment with 100 nM ET-1, as indicated. Quantitative analysis of cardiomyocyte hypertrophy is shown on the right. 51–100 NRVMs were analyzed per condition (n > 50). *, P < 0.05 versus control. Bar, 50 µm. (C) TUNEL assays of NRVMs transduced with Ad–HDAC4-WT, -S/A, 2–201 (NT), or 2–289. Apoptotic nuclei appear in green, and NRVMs were counterstained for sarcomeric α-actinin. Nontransduced NRVMs (control) serve as a negative control, and adriamycin-treated NRVMs serve as a positive control. Quantitative analysis of apoptotic nuclei per NRVMs is shown on the right. More than 55 NRVMs per condition were analyzed in four to eight selected fields. The percentage in each field was quantified (n ≥ 4). *, P < 0.05 versus control. Bar, 200 µm. (D) Annexin V–FITC/PI staining of NRVMs. NRVMs were nontreated (control), treated with adriamycin (positive control), or transduced with Ad–HDAC4-FL, -S/A, 2–201 (NT), or 2–289. Quantitative analysis of annexin V and PI-positive cells per total cell number is shown on the right. 59–144 cells were analyzed per condition in three to five selected fields. The percentage in each field was quantified (n ≥ 3). *, P < 0.05 versus control. Bar, 100 µm.
Figure 8.
Figure 8.
PKA-dependent proteolysis of HDAC4 overcomes CaMKII-mediated MEF2 activation. (A) A schematic of HDAC4 highlighting its domains involved in CaMKII and PKA signaling as well as MEF2 and SRF repression. P, phosphorylated serine. (B) Chronic β-adrenergic stimulation leads, via calcium-dependent mechanisms, to CaMKII activation, which mediates cytosolic accumulation of HDAC4 and activation of MEF2- and SRF-dependent gene programs. In contrast, acute adrenergic stimulation leads to cAMP-dependent PKA activation, which mediates proteolytic processing of HDAC4 to HDAC4-NT. HDAC4-NT acts as a CaMKII-insensitive repressor of MEF2 but not SRF.

References

    1. Ago T., Liu T., Zhai P., Chen W., Li H., Molkentin J.D., Vatner S.F., Sadoshima J. 2008. A redox-dependent pathway for regulating class II HDACs and cardiac hypertrophy. Cell. 133:978–993 10.1016/j.cell.2008.04.041 - DOI - PubMed
    1. Backs J., Olson E.N. 2006. Control of cardiac growth by histone acetylation/deacetylation. Circ. Res. 98:15–24 10.1161/01.RES.0000197782.21444.8f - DOI - PubMed
    1. Backs J., Song K., Bezprozvannaya S., Chang S., Olson E.N. 2006. CaM kinase II selectively signals to histone deacetylase 4 during cardiomyocyte hypertrophy. J. Clin. Invest. 116:1853–1864 10.1172/JCI27438 - DOI - PMC - PubMed
    1. Backs J., Backs T., Bezprozvannaya S., McKinsey T.A., Olson E.N. 2008. Histone deacetylase 5 acquires calcium/calmodulin-dependent kinase II responsiveness by oligomerization with histone deacetylase 4. Mol. Cell. Biol. 28:3437–3445 10.1128/MCB.01611-07 - DOI - PMC - PubMed
    1. Backs J., Backs T., Neef S., Kreusser M.M., Lehmann L.H., Patrick D.M., Grueter C.E., Qi X., Richardson J.A., Hill J.A., et al. 2009. The delta isoform of CaM kinase II is required for pathological cardiac hypertrophy and remodeling after pressure overload. Proc. Natl. Acad. Sci. USA. 106:2342–2347 10.1073/pnas.0813013106 - DOI - PMC - PubMed

Publication types

MeSH terms

Substances