. 2011 Dec 15;71(24):7387-97.
doi: 10.1158/0008-5472.CAN-11-1226. Epub 2011 Oct 31.

In vivo magnetic resonance imaging of the estrogen receptor in an orthotopic model of human breast cancer

Affiliations

In vivo magnetic resonance imaging of the estrogen receptor in an orthotopic model of human breast cancer

Adi Pais et al. Cancer Res. .

Abstract

Histologic overexpression of the estrogen receptor α (ER) is a well-established prognostic marker in breast cancer. Noninvasive imaging techniques that could detect ER overexpression would be useful in a variety of settings where patients' biopsies are problematic to obtain. This study focused on developing, by in vivo MRI, strategies to measure the level of ER expression in an orthotopic mouse model of human breast cancer. Specifically, novel ER-targeted contrast agents based on pyridine-tetra-acetate-Gd(III) chelate (PTA-Gd) conjugated to 17β-estradiol (EPTA-Gd) or to tamoxifen (TPTA-Gd) were examined in ER-positive or ER-negative tumors. Detection of specific interactions of EPTA-Gd with ER were documented that could differentiate ER-positive and ER-negative tumors. In vivo competition experiments confirmed that the enhanced detection capability of EPTA-Gd was based specifically on ER targeting. In contrast, PTA-Gd acted as an extracellular probe that enhanced ER detection similarly in either tumor type, confirming a similar vascular perfusion efficiency in ER-positive and ER-negative tumors in the model. Finally, TPTA-Gd accumulated selectively in muscle and could not preferentially identify ER-positive tumors. Together, these results define a novel MRI probe that can permit selective noninvasive imaging of ER-positive tumors in vivo.


Figures

Figure 1
Figure 1
The chemical structure of the ER targeted probes, 17β-estradiol pyridine-tetra-acetate-Gd (EPTA-Gd) and tamoxifen pyridine-tetra-acetate-Gd (TPTA-Gd), and of the paramagnetic chelate pyridine-tetra-acetate-Gd (PTA-Gd).
Figure 2
Figure 2
Growth curves, histopathology and ERα immunostaining of ER-positive and ER-negative MDA-MB-231 human breast cancer tumors implanted in the fat pad of CB-17 SCID mice. (A) Growth curves of ER-positive and ER-negative tumors. Tumor volume was measured by caliper and estimated assuming a hemi-ellipsoid tumor shape. Data shown are mean volume±SD, n=10. ER-positive and ER-negative tumors' growth rates were similar (P>0.9, paired t-test in all days). (B) H&E staining of ER-positive tumor demonstrating viable regions rich in blood vessels (V) and regions of nuclear dust inside the tumor. (C and D) Immunohistochemical staining of ERα in ER-positive (C) and ER-negative (D) tumor sections.
Figure 3
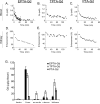
Figure 3
Pharmacokinetics and biodistribution of EPTA-Gd, TPTA-Gd and PTA-Gd in SCID mice. (A–C) Kinetics of EPTA-Gd and TPTA-Gd concentration in blood (Cb) and of PTA-Gd concentration in plasma (Cp). The agents were administrated as bolus injection into the tail vein of CB-17 SCID mice at the following doses: EPTA-Gd 0.1 mmol/kg; TPTA-Gd 0.075 mmol/kg; PTA-Gd 0.15 mmol/kg. T1-weighted, gradient-echo MR images of a major blood vessel were recorded sequentially. EPTA-Gd kinetics was performed in a separate set of experiments from the contrast enhanced studies of the tumors, monitoring the jugular vein. TPTA-Gd and PTA-Gd kinetics were monitored in descending aorta analyzing coronal images scanned together with the scanning of the tumors. Signal enhancement was converted to blood concentration units and then fitted to a biexponential decay as described in the Methods section and in supplemented data. The decay rate constants in the blood and plasma are given in the text. (D–F) The time courses of enhancement in the kidney cortex. (G). Biodistribution of EPTA-Gd, TPTA-Gd and PTA-Gd in CB-17 SCID mice. The Gd(III) content was examined by ICP-MS at 50 minutes post-injection of a dose of 0.1 mmol/kg of each contrast agent into the tail vein. Data presented as mean ±SD of n=6 for EPTA-Gd and TPTA-Gd and n=5 for PTA-Gd.
Figure 4
Figure 4
In vivo EPTA-Gd, TPTA-Gd, and PTA-Gd DCE-MRI of ER-positive and ER-negative MDA-MB-231 human breast cancer tumors implanted in mice. (A) T2-weighted images demonstrating the anatomy of ER-positive (right side) and ER-negative (left side) tumors, 2 to 3 weeks after cell inoculation. The tumors' boundaries are marked in white. (B) Enhancement maps in ER-positive and ER-negative tumors 20 minutes after bolus injection of each contrast agent into the tail vein of the mice. The enhancement values in the tumor region are superimposed on the corresponding T1-weighted image. (C) Enhancement time courses calculated for the entire volume of each tumor demonstrated in A and for an adjacent muscle tissue. The dose of each contrast agent, D, is provided on the left. Note differences in the extent of enhancement in the tumors and in the muscle tissue, for each contrast agent. (D) Enhancement time courses of EPTA-Gd (dose= 0.075mmol/kg) in a competition experiment calculated for the entire volume of each tumor. Left: Competition with OHT (dose=0.1mmol/kg). Right: Competition with TAM (dose= 0.07 mmol/kg). Note a similar enhancement pattern and extent in ER-positive and ER-negative tumors.
Figure 5
Figure 5
Principal component analysis of enhancement-scaled dataset of DCE-MRI with EPTA-Gd, TPTA-Gd and PTA-Gd. (A) The magnitude of the eight eigenvalues in descending order from n experiments, (n=9 for EPTA-Gd and n=4 for TPTA-Gd and PTA-Gd). Percentage reflects the percent of each eigenvalue normalized to the sum of 100% for all eigenvalues. Note the reproducibility of the changes in the eigenvalues. (B and C). The 1st and 2nd eigenvectors of n DCE-MRI experiments, (n=9 for EPTA-Gd and n=4 for TPTA-Gd and PTA-Gd). (D) Anatomical, T2-weighted axial images demonstrating the ER-positive (right side) and ER-negative (left side) tumors. The tumors' boundaries are marked in white. (E) Projection coefficient maps of the 1st eigenvector in the tumors' ROI overlaid on the T1-weighted images.

References

    1. Pruthi S, Brandt KR, Degnim AC, Goetz MP, Perez EA, Reynolds CA, et al. A multidisciplinary approach to the management of breast cancer, part 1: prevention and diagnosis. Mayo Clin Proc. 2007;82:999–1012. - PubMed
    1. Sorlie T, Perou CM, Tibshirani R, Aas T, Geisler S, Johnsen H, et al. Gene expression patterns of breast carcinomas distinguish tumor subclasses with clinical implications. Proc Natl Acad Sci U S A. 2001;98:10869–74. - PMC - PubMed
    1. Hu Z, Fan C, Oh DS, Marron JS, He X, Qaqish BF, et al. The molecular portraits of breast tumors are conserved across microarray platforms. BMC Genomics. 2006;7:96. - PMC - PubMed
    1. Perou CM, Sorlie T, Eisen MB, van de Rijn M, Jeffrey SS, Rees CA, et al. Molecular portraits of human breast tumours. Nature. 2000;406:747–52. - PubMed
    1. Yang XR, Sherman ME, Rimm DL, Lissowska J, Brinton LA, Peplonska B, et al. Differences in risk factors for breast cancer molecular subtypes in a population-based study. Cancer Epidemiol Biomarkers Prev. 2007;16:439–43. - PubMed

Publication types

MeSH terms