. 2011;6(10):e26388.
doi: 10.1371/journal.pone.0026388. Epub 2011 Oct 17.

UV-sensitive photoreceptor protein OPN5 in humans and mice

Affiliations

UV-sensitive photoreceptor protein OPN5 in humans and mice

Daisuke Kojima et al. PLoS One. 2011.

Abstract

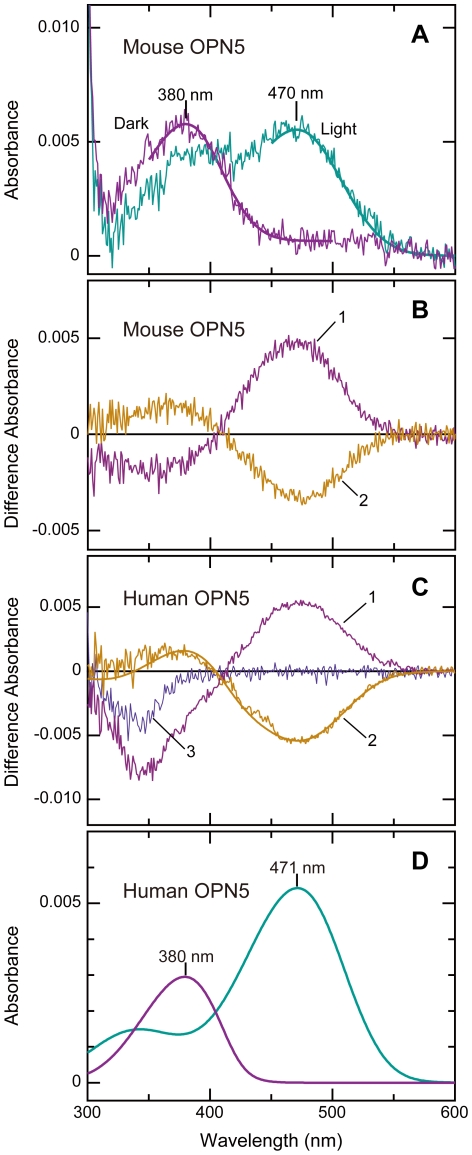
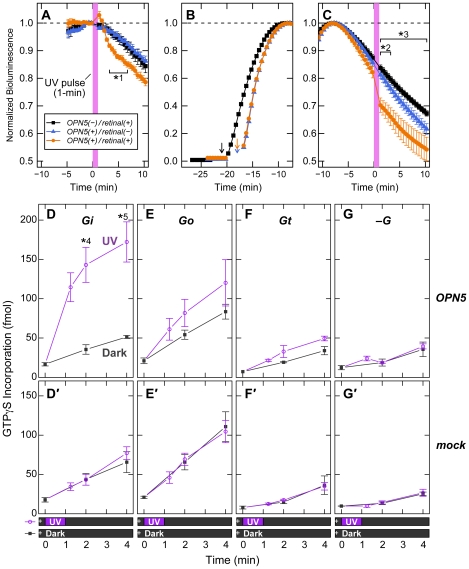
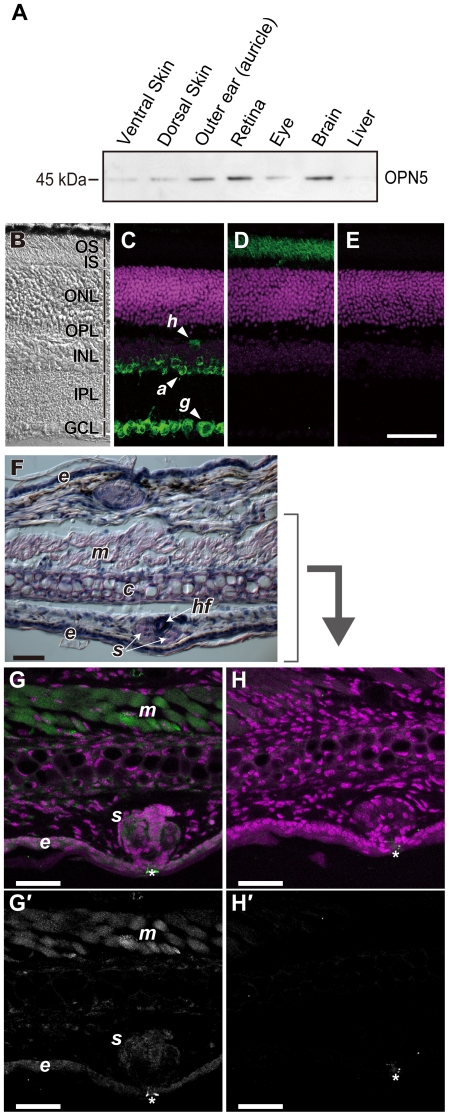
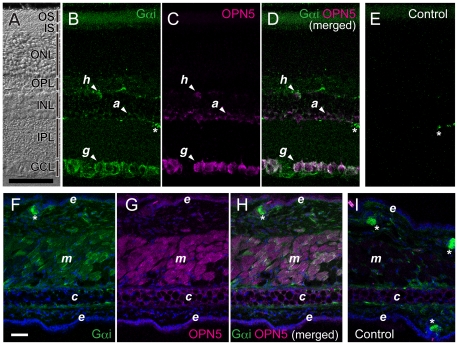
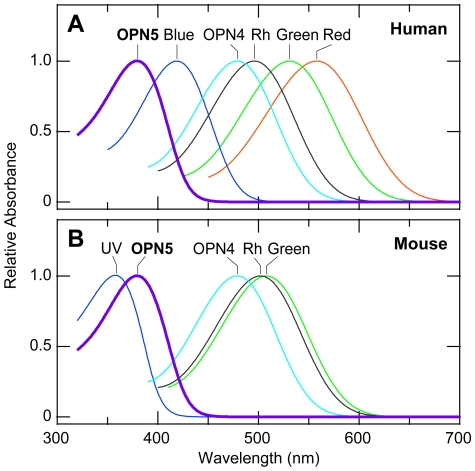
A variety of animal species utilize the ultraviolet (UV) component of sunlight as their environmental cues, whereas physiological roles of UV photoreception in mammals, especially in human beings, remain open questions. Here we report that mouse neuropsin (OPN5) encoded by the Opn5 gene exhibited an absorption maximum (λmax) at 380 nm when reconstituted with 11-cis-retinal. Upon UV-light illumination, OPN5 was converted to a blue-absorbing photoproduct (λmax 470 nm), which was stable in the dark and reverted to the UV-absorbing state by the subsequent orange light illumination, indicating its bistable nature. Human OPN5 also had an absorption maximum at 380 nm with spectral properties similar to mouse OPN5, revealing that OPN5 is the first and hitherto unknown human opsin with peak sensitivity in the UV region. OPN5 was capable of activating heterotrimeric G protein Gi in a UV-dependent manner. Immuno-blotting analyses of mouse tissue extracts identified the retina, the brain and, unexpectedly, the outer ears as the major sites of OPN5 expression. In the tissue sections of mice, OPN5 immuno-reactivities were detected in a subset of non-rod/non-cone retinal neurons as well as in the epidermal and muscle cells of the outer ears. Most of these OPN5-immuno-reactivities in mice were co-localized with positive signals for the alpha-subunit of Gi. These results demonstrate the first example of UV photoreceptor in human beings and strongly suggest that OPN5 triggers a UV-sensitive Gi-mediated signaling pathway in the mammalian tissues.


Conflict of interest statement

Competing Interests: The authors have declared that no competing interests exist.

Figures

Figure 1
Figure 1. Mammalian OPN5 is a UV light-sensitive photopigment with 11-cis-retinal bound and exhibits a bistable nature.
(A) Absorption spectra of mouse OPN5 (Dark) and its photoproduct (Light). The mouse OPN5 having 1D4-tag in the C-terminus was produced in a cell line of HEK293S cells (HEK293S-mOPN5#11), reconstituted with 11-cis-retinal, and affinity-purified with 1D4 antibody-immobilized resin (see Materials & Methods for details). The OPN5 (λmax 380 nm) was irradiated with UV light (357 nm; half band size, 10 nm; 28 µW/cm2) for 32 min, resulting in formation of a blue-absorbing photoproduct (λmax 470 nm). (B) Bistable photoreaction of mouse OPN5. The OPN5 in the dark (state 1; “Dark” in panel A) was first irradiated with 357-nm UV light (state 2; “Light” in panel A) and subsequently with >520-nm orange light (state 3; 10 mW/cm2, given that it was 550-nm monochromatic light). Shown are the difference spectra of state 2 minus state 1 (curve 1) and state 3 minus state 2 (curve 2), revealing back-and-forth photoreactions between OPN5 (λmax 380 nm) and the blue-absorbing photoproduct (λmax 470 nm). (C) Bistable photoreaction of human OPN5. The reconstituted sample for human OPN5 was obtained by solubilizing the membrane fraction of a stable cell line expressing human OPN5 (HEK293S-hOPN5#48). This partially purified human OPN5 was, as in panel B, subjected to illumination with 357-nm UV light (curve 1; 80 µW/cm2) and subsequently with >480-nm yellow light (curve 2; 3.6 mW/cm2, given that it was 550-nm monochromatic light) to obtain difference spectra in a similar manner to panel B. The difference spectra (curves 1 and 2) were similar in shape to those for mouse OPN5, indicating bistable photoreactions between a UV-absorbing pigment and a blue-absorbing species. Note that enhanced decrease of absorbance in <380-nm region during UV illumination (curve 1) can be partly due to photoreaction by non-OPN5 molecule(s) as this photoreaction also occurred in the control preparation using HEK293S cells (curve 3). (D) Estimation of the absorption spectrum for human OPN5. The spectra for human OPN5 and its photoproduct were estimated from curve 2 in panel C by using spectral templates for opsin-type photopigments (see Fig. S2 for details).
Figure 2
Figure 2. UV-dependent activation of Gi-type G protein by OPN5.
(A–C) UV-induced cAMP reduction in OPN5-expressing HEK293S cells. The HEK293S-mOPN5#11 cells [OPN5(+)] or the wild-type HEK293S cells [OPN5(–)] were introduced with the expression vector of GloSensor protein, a luciferase derivative whose activity reflects cytosolic cAMP levels, and then the cells were cultured in the medium supplemented with 1 µM of 11-cis-retinal [retinal(+)] or without retinal [retinal(–)]. The bioluminescence of the cell culture was continuously monitored in the presence of luciferin. (A) The cells were first kept in the dark until their bioluminescence became stable, and then the cells were irradiated with 379-nm light for 1 min (indicated with violet). The bioluminescence values were normalized by those just before the irradiation for each dish. The data are represented by the mean ± SEM (n = 3) for OPN5(–)/retinal(+) and OPN5(+)/retinal(+), or by the mean ± SD (n = 2) for OPN5(+)/retinal(–). Statistical significance for the difference between the OPN5(+)/retinal(+) and OPN5(–)/retinal(+) data is shown as the asterisk (*1, p<0.05 by two-tailed Student's t-test). (B, C) Prior to the UV irradiation, the cells were stimulated with 10 µM of forskolin to increase the cAMP level. Shown in the panel B are the representative inductions in bioluminescence by forskolin, which was supplied into the cell culture at the indicated time points (arrows). Eight minutes after the bioluminescence peaking at the maximal values (C), the cells were irradiated with 379-nm light for 1 min (indicated with violet). The bioluminescence values were normalized by the maximal value for each dish. The UV-dependent reduction required both OPN5 and 11-cis-retinal. In the panel C, statistical significance of the OPN5(+)/retinal(+) data is shown as the asterisks (*2, p<0.05 against the OPN5(+)/retinal(–) data; *3, p<0.05 against the OPN5(–)/retinal(+) data) by one-way ANOVA with Tukey's post hoc test. (D–G, D′–G′) The UV-evoked activations of G proteins by OPN5 were measured by GTPγS-binding assays using the membrane fraction of the HEK293T/17 cells transfected with the expression construct for mouse OPN5 (D–G) or mock-transfected (D′–G′). Mixture of the membrane and the purified Gi (D, D′), Go (E, E′), Gt (F, F′), or no G protein (G, G′) was supplied with [35S] GTPγS (indicated by a cross in the bars under the horizontal axes) and then irradiated with 379-nm light (UV) or no light (Dark) for 1 min. The incorporated GTPγS was quantified at each time point after the irradiation and subjected to statistical analyses by two-tailed Student's t-test (*4, p = 0.0095; *5, p = 0.041). UV-dependent activation of Gi by OPN5 was detected in the panel D, whereas Go (E) and Gt (F) showed only slight tendencies of UV-dependent activation by OPN5, however, with no statistical significance at any time point. In the control experiments without OPN5 (mock), no significant difference in GTPγS incorporation was detected between UV and Dark (D′–G′). The data were represented by the mean ± SEM (n = 3; D–G, D′-F′) or by the mean ± SD (n = 2; G′).
Figure 3
Figure 3. Localization of OPN5 protein in mouse tissues.
(A) Western blot analysis of mouse tissue extracts by anti-OPN5 antibody. Ten microgram of total proteins were loaded in each lane for tissue extracts of ventral and dorsal skin, outer ears (auricles), retina, eyes, brain and liver. A stronger immuno-reactive signal was detected at 45 kDa in the outer ears (auricles), retina and brain. (B–E) Immunofluorescent examination of frozen sections from mouse retina. The sections were either imaged through differential interference contrast (B), or stained with anti-OPN5 antibody (C), with anti-Gαt1 antibody (D) or with depletion of primary antibody (E). (F–H) Histological and immunofluorescent examination of frozen sections from mouse outer ears (auricles); stained with hematoxylin-eosin (F), immuno-reacted with anti-OPN5 antibody (G and G′) or with rabbit normal IgG (H and H′). The panels C, D, E, G and H show immuno-reactive signals (green) as well as nuclear staining (magenta), while the panels G′ and H′ present the immuno-reactive signals alone (white) shown in the panels G and H, respectively. The signals indicated by asterisks (*) in the panels G, G′, H and H′ were autofluorescence of the hairs. a, amacrine cells; g, ganglion cells; h, horizontal cells; OS, outer segments of photoreceptors; IS, inner segments of photoreceptors; ONL, outer nuclear layer; OPL, outer plexiform layer; INL, inner nuclear layer; IPL, inner plexiform layer; GCL, ganglion cell layer. c, cartilage; e, epidermis; hf, hair follicle; m, striated muscle; s, sebaceous gland. Scale bars, 50 µm.
Figure 4
Figure 4. Co-localization of Gαi and OPN5 proteins in the retina and the outer ears of mice.
(A–E) A section of mouse retina was reacted with antibodies to Gαi (sc-365422) and OPN5: The section was imaged through differential interference contrast (A), and subjected to fluorescence imaging for Gαi immuno-positive signals (B, green) and for OPN5 immuno-positive signals (C, magenta). The panel D shows the merged image of B and C, while the panel E gives its negative control (with depletion of the primary antibodies, i.e., the secondary antibodies alone). (F–I) A section of mouse outer ear was reacted with antibodies to Gαi (sc-365422) and OPN5: The section was subjected to fluorescence imaging for Gαi immuno-positive signals (F, green) and for OPN5 immuno-positive signals (G, magenta). The panel H shows the merged image of F and G, while the panel I gives its negative control (with depletion of the primary antibodies, i.e., the secondary antibodies alone). In the panels F–I, nuclear staining by TO-PRO-3 was colored in blue. Note that the green signals indicated by asterisks (*) in the panels B, D, E, F, H, and I originated from cross-reaction of the secondary antibody to the endogenous IgG present in the mouse tissues. Similar immuno-staining patterns of Gαi were detected by another antibody to Gαi in the retina and the outer ears (see Fig. S9). Scale bars, 50 µm. Abbreviations are the same as in Figure 3.
Figure 5
Figure 5. Schematic drawing of absorption spectra of opsin-type photopigments in human and mouse.
These absorption spectra were drawn by using a spectral template according to the reported values for absorption maxima (nm): human rhodopsin (Rh, 496 nm [40]), red (558 nm [40]), green (531 nm [40]), blue (419 nm [40]), OPN4 (479 nm [41]) , OPN5 (380 nm, this study); mouse rhodopsin (Rh, 502 nm [42]), green (508 nm [43]), UV (359 nm [44]), OPN4 (479 nm [45]), OPN5 (380 nm, this study).

References

    1. Eisner T, Silberglied RE, Aneshansley D, Carrel JE, Howland HC. Ultraviolet video-viewing: the television camera as an insect eye. Science. 1969;166:1172–4. - PubMed
    1. Froy O, Gotter AL, Casselman AL, Reppert SM. Illuminating the circadian clock in monarch butterfly migration. Science. 2003;300:1303–5. - PubMed
    1. Bennett A, Cuthill I, Partridge J, Maier E. Ultraviolet vision and mate choice in zebra finches. Nature. 1996;380:433–5.
    1. Jourdie V, Moureau B, Bennett A, Heeb P. Ecology: ultraviolet reflectance by the skin of nestlings. Nature. 2004;431:262. - PubMed
    1. Jacobs GH. Ultraviolet vision in vertebrates. Amer Zool. 1992;32:544–554.

Publication types