. 2012 Jan;135(1):73-88.
doi: 10.1111/j.1365-2567.2011.03514.x.

miR-155 modulates microglia-mediated immune response by down-regulating SOCS-1 and promoting cytokine and nitric oxide production

Affiliations

miR-155 modulates microglia-mediated immune response by down-regulating SOCS-1 and promoting cytokine and nitric oxide production

Ana L Cardoso et al. Immunology. 2012 Jan.

Abstract

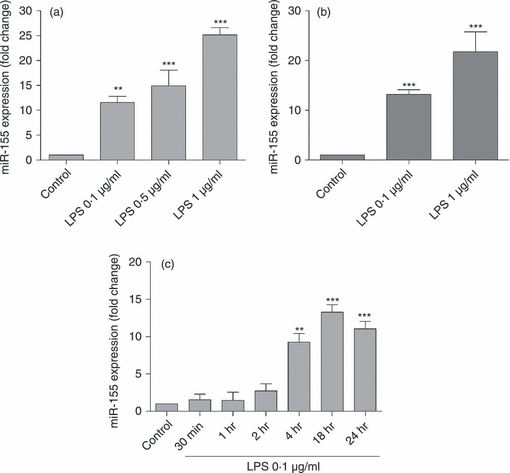
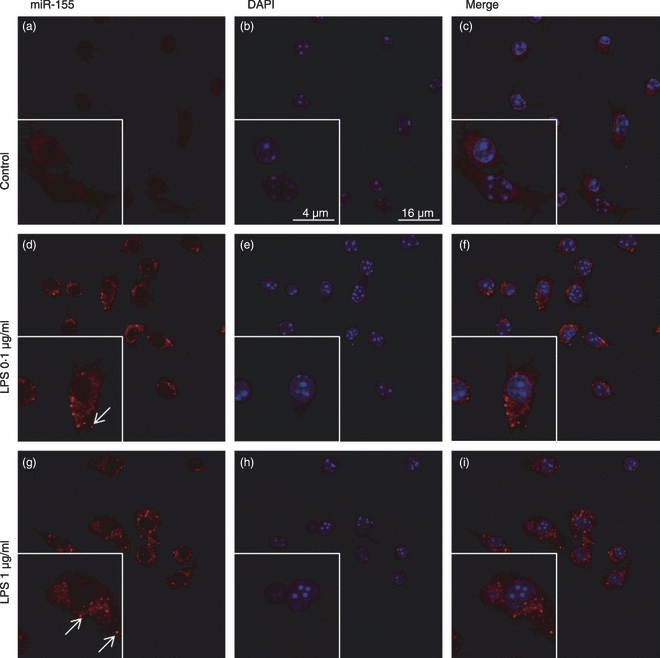
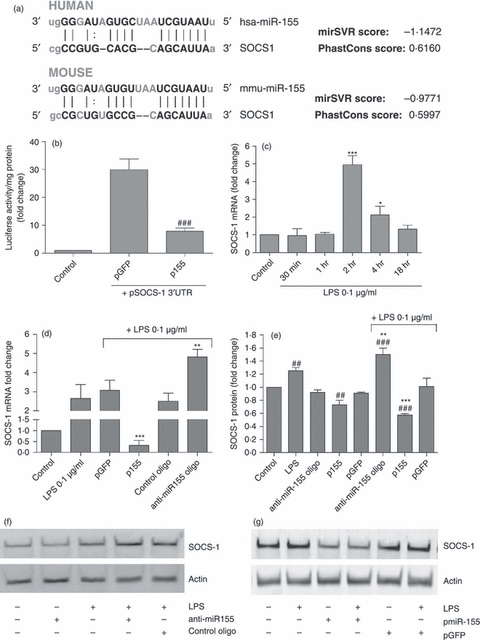
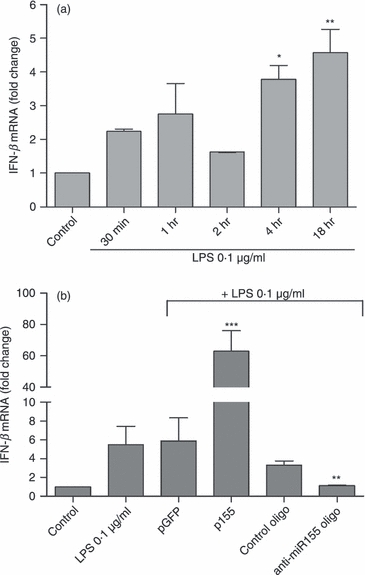
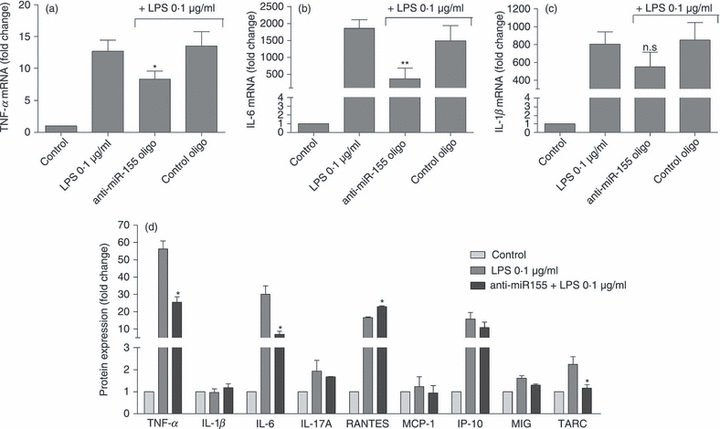
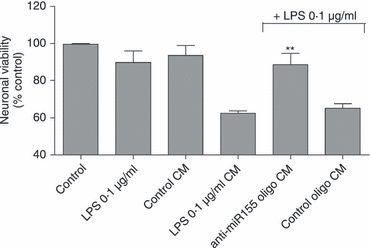
Innate immunity constitutes the first line of defence against both external and endogenous threats in the brain, and microglia cells are considered key mediators of this process. Recent studies have shown that microRNAs (miRNAs) may play a determinant role in the regulation of gene expression during innate immune responses. The major goal of this work was to investigate the contribution of a specific miRNA - miR-155 - to the modulation of the microglia-mediated immune response. For this purpose, in vitro studies were performed in N9 microglia cells to evaluate changes in the levels of this miRNA following microglia activation. A strong up-regulation of miR-155 expression was observed following microglia exposure to lipopolysaccharide, which was consistent with a decrease in the levels of the suppressor of cytokine signalling 1 (SOCS-1) protein, a key inhibitor of the inflammatory process and a predicted target of miR-155. The miR-155 knockdown by anti-miRNA oligonucleotides up-regulated SOCS-1 mRNA and protein levels and significantly decreased the production of nitric oxide and the expression of inflammatory cytokines and inducible nitric oxide synthase. Finally, treatment of neuronal primary cultures with conditioned medium obtained from microglia cells, in which miR-155 was inhibited before cell activation, decreased inflammatory-mediated neuronal cell death. Overall, our results show that miR-155 has a pro-inflammatory role in microglia and is necessary for the progression of the immune response through the modulation of SOCS-1, suggesting that, in a chronic inflammatory context, miR-155 inhibition can have a neuroprotective effect.


Figures

Figure 1
Figure 1
Quantification of microRNA-155 (miR-155) expression following microglia activation with lipopolysaccharide (LPS). N9 microglia cells (a) or primary microglia cultures (b) were incubated with LPS at 0.1, 0.5 or 1 μg/ml for 18 hr. Alternatively, N9 cells were incubated with LPS at 0.1 μg/ml for different periods of time (30 min, 1 hr, 2 hr, 4 hr, 18 hr and 24 hr) (c). Following cell incubation with LPS, total RNA was extracted and miR-155 levels were determined by quantitative real-time RT-PCR using specific LNA probes for the mature form of this miRNA. Results are presented as miR-155 fold change with respect to control (untreated cells). **P< 0.01 and ***P< 0.001 compared with control. Results are representative of three independent experiments performed in triplicates.
Figure 2
Figure 2
Evaluation of microRNA-155 (miR-155) expression in primary microglia cultures using in situ hybridization. Primary microglia cultures were incubated with lipopolysaccharide (LPS) at 0.1 or 1 μg/ml for 18 hr before miR-155 labelling using a DIG-conjugated LNA-based probe, specific for the mature form of this miRNA. Expression of miR-155 (red) was detected using an anti-DIG antibody and the TSA Cy3 signal amplification system (a), (d) and (g). In parallel studies, the levels of miR-155 were also analysed in untreated microglia cells. The cell nuclei were labelled with DAPI (blue) (b), (e) and (h). Representative confocal microscopy images of all experimental conditions are presented at a 600 × magnification. (c), (f) and (i) show merged images of all three channels.
Figure 3
Figure 3
Modulation of suppressor of cytokine signalling 1 (SOCS-1) mRNA and protein levels by microRNA-155 (miR-155). (a) SOCS-1 was found to be a predicted target of miR-155 in both humans and mice and (b) validation of miR-155 binding to the 3′UTR of SOCS-1 was achieved using a luciferase reporter assay. N9 cells were transfected with pmiR-155 and pSOCS-1 3′UTR for 4 hr. Forty-eight hours after transfection, luciferase activity and protein levels were determined in all samples. Cell co-transfection with pGFP and pSOCS-1 3′UTR was used as a positive control in this experiment. Results are presented as the fold increase in luciferase activity/mg protein with respect to control (non-transfected cells). ###P< 0.001 compared with cells transfected with pGFP and pSOCS-1 3′UTR (c) The time–course of SOCS-1 expression was determined by quantitative real-time (q) RT-PCR. N9 cells were incubated with lipopolysaccharide (LPS) at 0.1 μg/ml for different periods of time (30 min, 1 hr, 2 hr, 4 hr and 18 hr). Results are presented as SOCS-1 mRNA fold change with respect to control (untreated cells). *P < 0.05 and ***P < 0.001 compared with control. SOCS-1 (d) mRNA and (e) protein levels were determined by qRT-PCR and Western blot, respectively. N9 cells were transfected with anti-miR-155 oligonucleotides (anti-miR155 oligo) or miR-155-encoding plasmid (p155) for 4 hr. Alternatively, N9 cells were transfected with non-targeting oligonucleotides (control oligo) or a plasmid encoding GFP (pGFP). Twenty-four hours after transfection, cells were incubated with LPS at 0.1 μg/ml for 4 hr and RNA and protein extractions were performed. Representative Western blot images illustrate the reduction or increase in SOCS-1 protein levels, following miR-155 (f) down-regulation or (g) up-regulation, respectively. Results are expressed as SOCS-1 mRNA or protein fold change with respect to control (non-transfected and untreated cells). ##P < 0.01 and ###P < 0.001 compared with control (untreated and non-transfected cells) and **P < 0.01 and ***P < 0.001 compared with LPS-treated cells in the absence of transfection. All results are representative of three independent experiments performed in triplicate.
Figure 4
Figure 4
Modulation of interferon-β (IFN-β) expression by microRNA-155 (miR-155). (a) N9 microglia cells were incubated with lipopolysaccharide (LPS) at 0.1 μg/ml for different periods of time (30 min, 1 hr, 2 hr, 4 hr and 18 hr). Results are presented as IFN-β mRNA fold change with respect to control (untreated cells). *P < 0.05 and **P < 0.01 compared with control. (b) The IFN-β expression levels were determined by quantitative real-time RT-PCR. N9 cells were transfected with anti-miR-155 oligonucleotides (anti-miR155 oligo) or miR-155-encoding plasmid (p155) complexed with cationic liposomes for 4 hr. Alternatively, N9 cells were transfected with non-targeting oligonucleotide (control oligo) or a plasmid encoding GFP (pGFP). Twenty-four hours after transfection, cells were incubated with LPS at 0.1 μg/ml for 18 hr and RNA extraction was performed. Results are expressed as IFN-β mRNA fold change with respect to control (untranfected and untreated cells). **P < 0.01 and ***P < 0.001 compared with LPS-treated cells in the absence of transfection. Results are representative of three independent experiments performed in triplicate.
Figure 5
Figure 5
Modulation of cytokine expression and secretion by microRNA-155 (miR-155). The mRNA of (a) tumour necrosis factor-α (TNF-α), (b) interleukin-6 (IL-6) and (c) IL-1β mRNA were quantified by quantitative RT-PCR. (d) The secretion of several inflammatory cytokines in response to relation with Toll-like receptor (TLR) activation was determined by ELISA. N9 cells were transfected with anti-miR-155 oligonucleotides (anti-miR155 oligo) or with a non-targeting oligonucleotide (control oligo) complexed with cationic liposomes for 4 hr. Twenty-four hours after transfection, cells were incubated with lipopolysaccharide (LPS) at 0.1 μg/ml for 18 hr. The cell culture medium was then collected to determine cytokine protein levels by ELISA and the RNA was extracted from the cells. Results are expressed as fold change in cytokine mRNA or protein levels with respect to control (untranfected and untreated cells). *P < 0.05 and **P < 0.01 compared with LPS-treated cells in the absence of transfection. Results in (a), (b) and (c) are representative of three independent experiments performed in triplicate. Results in (d) are representative of two independent experiments performed in triplicate.
Figure 6
Figure 6
Effect of microRNA-155 (miR-155) modulation on nitrite production and inducible nitric oxide synthase (iNOS) expression. (a) Nitrite production was quantified by the Griess Assay. The effect of miR-155 modulation on (b) iNOS mRNA was determined by quantitative RT-PCR and on (c) protein expression levels was determined by Western blot. N9 cells were transfected with anti-miR-155 oligonucleotides (anti-miR155 oligo) or miR-155-encoding plasmid (p155) complexed with cationic liposomes for 4 hr. Alternatively, N9 cells were transfected with non-targeting oligonucleotides (control oligo) or a plasmid encoding GFP (pGFP). Twenty-four hours after transfection, cells were incubated with lipopolysaccharide (LPS) at 0.1 μg/ml for 18 hr. The extracellular cell medium was then collected to quantify nitrite secretion through the Griess reaction and RNA and protein were extracted from the cells. (d) Representative Western blot images illustrate the increase or reduction in iNOS protein levels following miR-155 up-regulation or down-regulation, respectively. Results in (a) are expressed as % of nitrite production/mg protein in LPS-treated cells, in the absence of transfection. Results in (b) and (c) are expressed as mRNA or protein fold change with respect to control (untransfected and untreated cells). ##P < 0.01 and ###P < 0.001 compared with control (untreated and untransfected cells) and **P < 0.01 and ***P < 0.001 compared with LPS-treated cells in the absence of transfection. Results are representative of three independent experiments performed in triplicate.
Figure 7
Figure 7
Effect of microRNA-155 (miR-155) modulation on CD11b protein levels and cell morphology. The expression levels of CD11b and morphology of N9 cells were assessed by immunocytochemistry. N9 cells were transfected with anti-miR-155 oligonucleotides (anti-miR155 oligo) or non-targeting oligonucleotides (control oligo) for 4 hr. Twenty-four hours after transfection, cells were incubated with lipopolysaccharide (LPS) at 0.1 μg/ml for 18 hr before fixation and immunocytochemistry. N9 cells were labelled with anti-CD11b antibody (red) (a), (e), (i) and (m) or anti-tubulin antibody (green) (c), (g), (k) and (o). The nuclei were labelled with DAPI (blue) (b), (f), (j) and (n). Representative fluorescence microscopy images of all experimental conditions are presented at a 200 × magnification. (d), (h), (l) and (p) show merged images of all three channels.
Figure 8
Figure 8
Neuronal viability in the presence of microglia conditioned medium. Neuronal viability was assessed by the Alamar Blue Assay after exposure to conditioned medium obtained from N9 cells. N9 cells were transfected with anti-microRNA-155 (miR-155) oligonucleotides (anti-miR155 oligo) or non-targeting oligonucleotides (control oligo) for 4 hr. Twenty-four hours after transfection, cells were incubated with lipopolysaccharide (LPS) at 0.1 μg/ml for 18 hr and the N9 conditioned medium (CM) was collected. CM was also collected from untransfected and untreated N9 cells (control CM), or from untransfected LPS-treated cells (LPS 0.1 μg/ml CM). Primary cortical neurons were obtained at day 16 of gestation and cultured in Neurobasal medium (NBM) for 10 days before incubation with a mixture of CM and NBM at a ratio of 1 : 1 (v/v) for 24 hr. Alternatively, neuronal cultures were incubated directly with LPS at 0.1 μg/ml for the same period of time. Results are presented as a % of neuronal viability with respect to control cells. **P < 0.01 compared with neurons incubated with LPS 0.1 μg/ml CM. Results are representative of three independent experiments performed in triplicate.

Similar articles

Cited by

References

    1. Amor S, Puentes F, Baker D, van der Valk P. Inflammation in neurodegenerative diseases. Immunology. 2010;129:154–69. - PMC - PubMed
    1. Czlonkowska A, Kurkowska-Jastrzebska I. Inflammation and gliosis in neurological diseases – clinical implications. J Neuroimmunol. 2010;231:78–85. - PubMed
    1. Lehnardt S. Innate immunity and neuroinflammation in the CNS: the role of microglia in Toll-like receptor-mediated neuronal injury. Glia. 2010;58:253–63. - PubMed
    1. Qin L, Liu Y, Cooper C, Liu B, Wilson B, Hong JS. Microglia enhance β-amyloid peptide-induced toxicity in cortical and mesencephalic neurons by producing reactive oxygen species. J Neurochem. 2002;83:973–83. - PubMed
    1. Takeuchi H, Wang J, Kawanokuchi J, Mitsuma N, Mizuno T, Suzumura A. Interferon-gamma induces microglial-activation-induced cell death: a hypothetical mechanism of relapse and remission in multiple sclerosis. Neurobiol Dis. 2006;22:33–9. - PubMed

Publication types

LinkOut - more resources