. 2012 Feb;12(2):151-62.
doi: 10.2174/187152012799015002.

Pharmacologic inhibition of mTOR improves lapatinib sensitivity in HER2-overexpressing breast cancer cells with primary trastuzumab resistance

Affiliations

Pharmacologic inhibition of mTOR improves lapatinib sensitivity in HER2-overexpressing breast cancer cells with primary trastuzumab resistance

Sylvia S Gayle et al. Anticancer Agents Med Chem. 2012 Feb.

Abstract

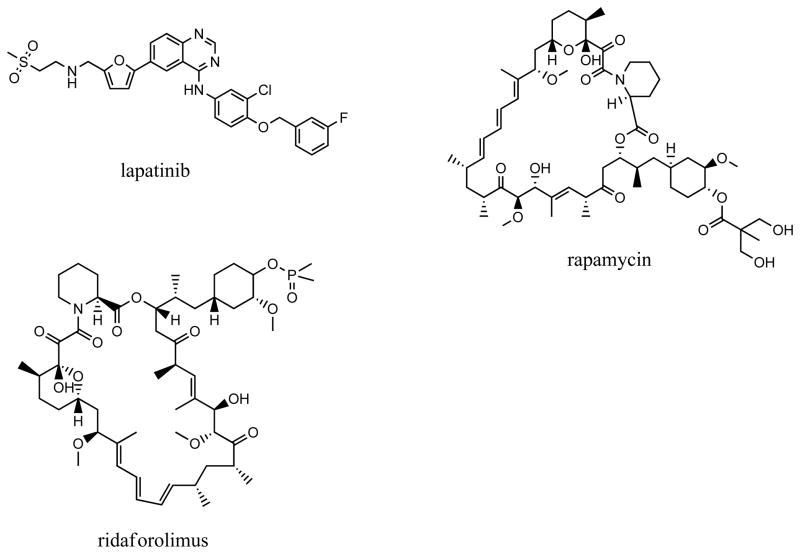
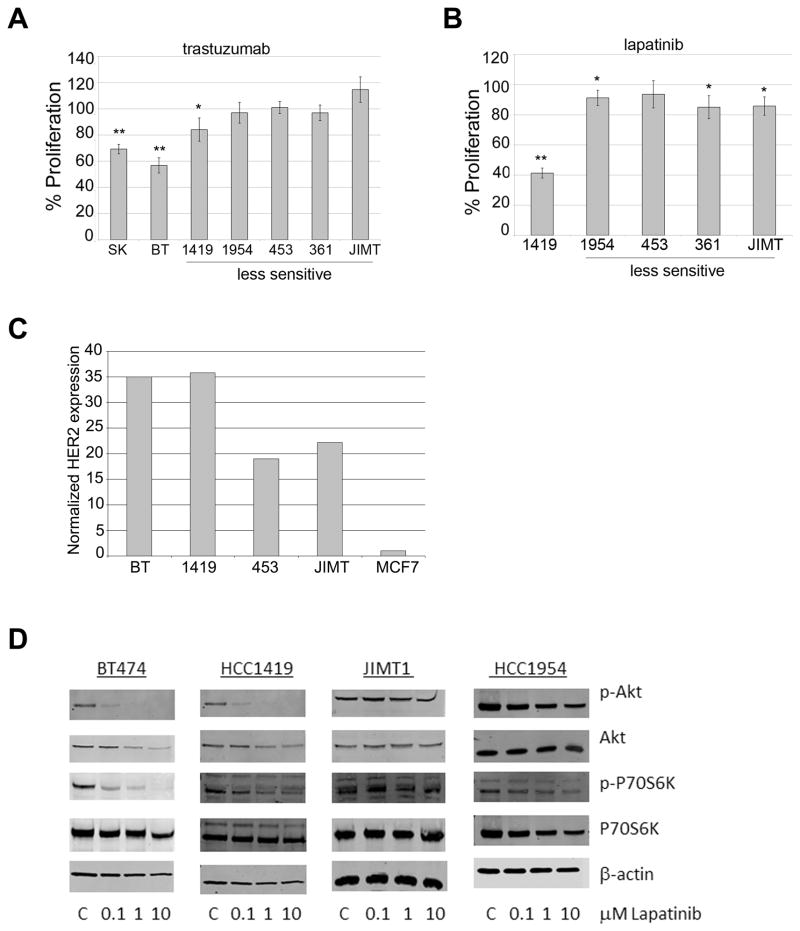
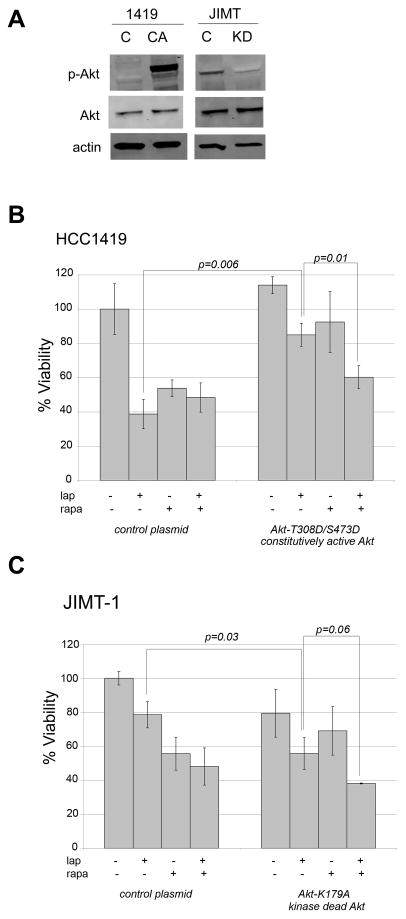
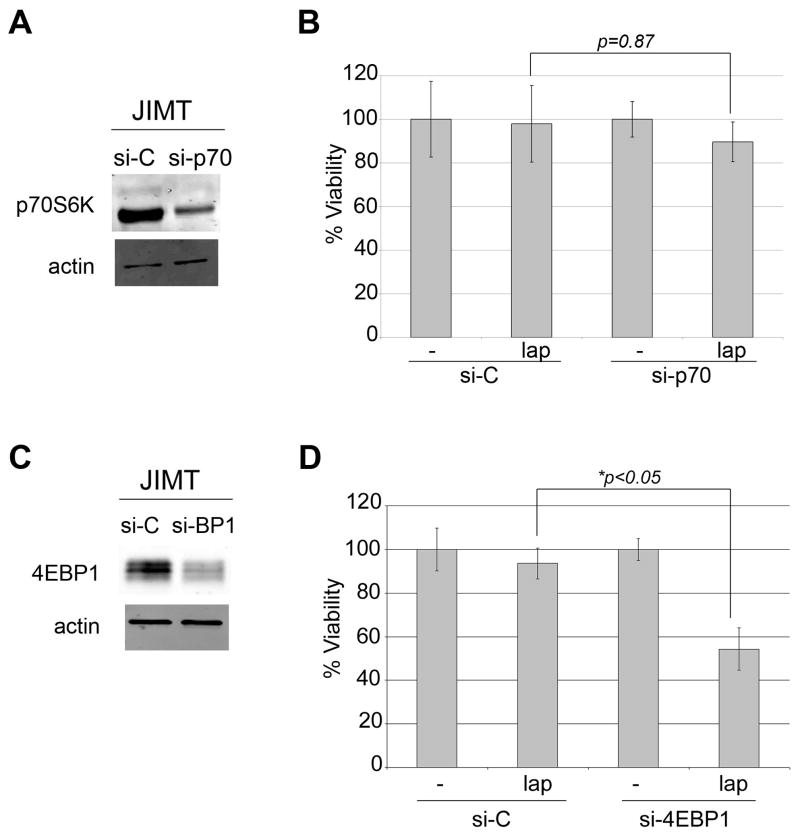
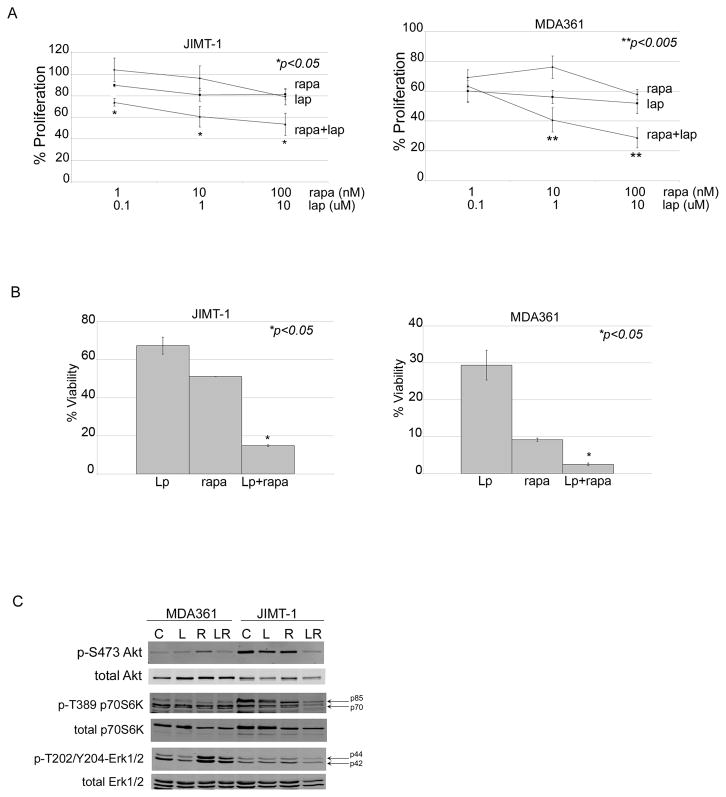
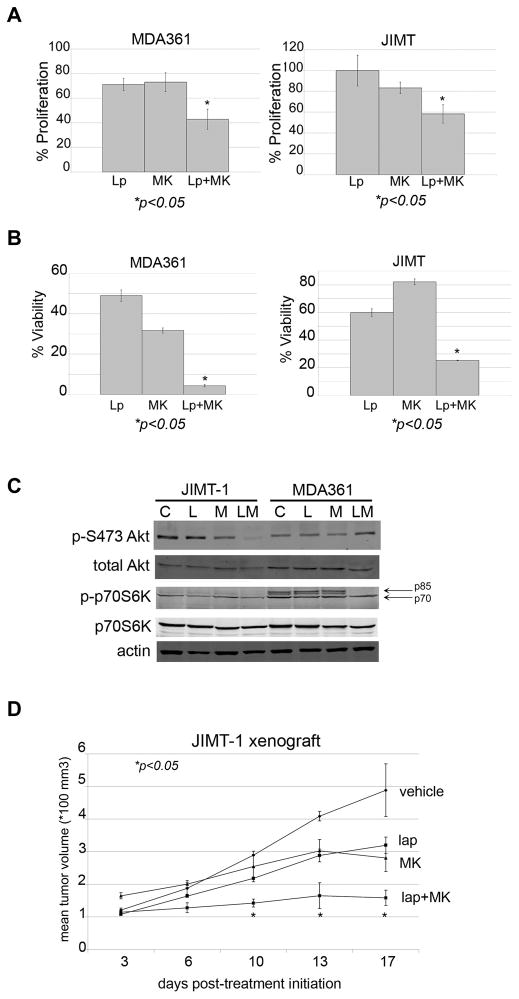
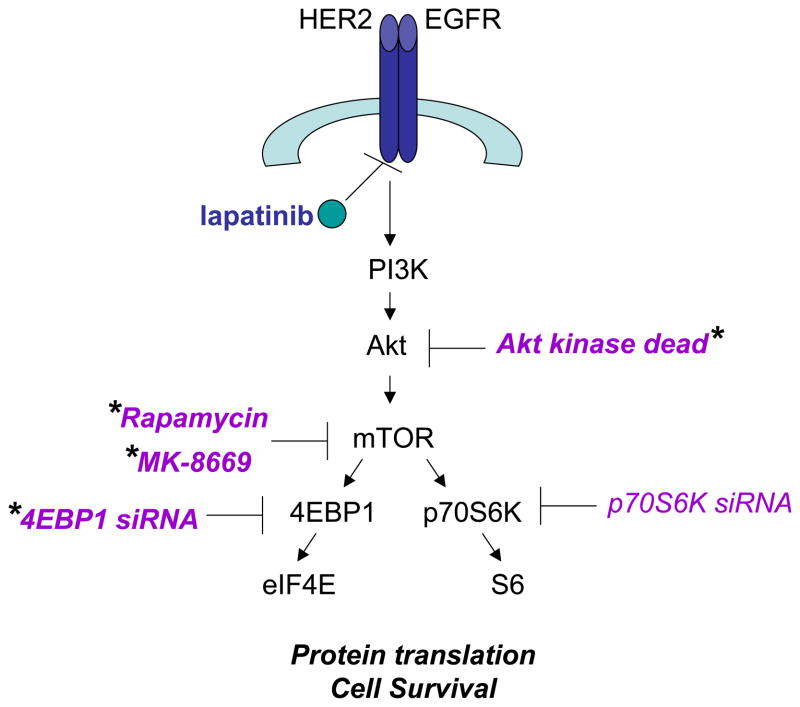
Lapatinib, a dual EGFR/HER2 kinase inhibitor, is approved for use in patients with trastuzumab-refractory HER2- overexpressing breast cancer. Increased PI3K signaling has been associated with resistance to trastuzumab, although its role in lapatinib resistance remains unclear. The purpose of the current study was to determine if PI3K/mTOR activity affects lapatinib sensitivity. Reduced sensitivity to lapatinib was associated with an inability of lapatinib to inhibit Akt and p70S6K phosphorylation. Transfection of constitutively active Akt reduced lapatinib sensitivity, while kinase-dead Akt increased sensitivity. Knockdown of 4EBP1 also increased lapatinib sensitivity, in contrast to p70S6K knockdown, which did not affect response to lapatinib. Pharmacologic inhibition of mTOR using rapamycin or ridaforolimus increased lapatinib sensitivity and reduced phospho-Akt levels in cells that showed poor response to single-agent lapatinib, including those transfected with hyperactive Akt. Finally, combination mTOR inhibition plus lapatinib resulted in synergistic inhibition of proliferation, reduced anchorage-independent growth, and reduced in vivo tumor growth of HER2- overexpressing breast cancer cells that have primary trastuzumab resistance. Our data suggest that PI3K/mTOR inhibition is critical for achieving optimal response to lapatinib. Collectively, these experiments support evaluation of lapatinib in combination with pharmacologic mTOR inhibition as a potential strategy for inhibiting growth of HER2-overexpressing breast cancers that show resistance to trastuzumab and poor response to lapatinib.


Figures

Figure 1
Figure 1. Chemical structures of kinase inhibitors
Structures for lapatinib, rapamycin, and the rapamycin analogue ridaforolimus (MK-8669) were downloaded from the ChemACX database (CambridgeSoft, Cambridge, MA) and drawn in ChemDraw (CambridgeSoft).
Figure 2
Figure 2. Analysis of anti-proliferative activity of lapatinib in primary trastuzumab-resistant HER2-overexpressing breast cancer cell lines
Proliferation was examined by MTS assay in cell lines treated with (A) 20 μg/mL trastuzumab, or (B) 0.1 μM lapatinib for 6 days. Values represent the average of 6 replicates per group as a percentage of untreated control cells (for trastuzumab) or DMSO-treated cells (for lapatinib). Error bars represent standard deviation between replicates. P-values were determined by t-test; *p<0.05, **p<0.005. Experiments were repeated three times with reproducible results. A representative immunoblot of total HER2 is shown for all cell lines. (C) Total protein lysates of cell lines were examined by Western blotting for total HER2. Bands were quanitated and values were normalized to actin levels. Total HER2 level is shown relative to MCF-7 cell line. (D) BT474, HCC1419, JIMT-1, and HCC1954 cells were treated with 0.1, 1 or 10 μM lapatinib, or with DMSO at the volume found in the highest dose of lapatinib (C, control) for 48 h. Whole cell protein lysates were immunoblotted for p-S473 Akt, total Akt, p-T389 p70S6K, total p70S6K, or actin loading control. Blots were repeated on at least two separate occasions with reproducible results.
Figure 3
Figure 3. Akt activation status affects lapatinib sensitivity
(A) HCC1419 cells were transiently transfected with 1 μg pcDNA3 vector control (C) or pcDNA3-Akt-T308D/S473D plasmid (CA), which expresses constitutively active Akt. JIMT-1 cells were transiently transfected with 1 μg pcDNA3 vector control (C) or pcDNA3-Akt-K179A plasmid (KD), which expresses kinase dead Akt. Total protein lysates were collected after 48 h and immunoblotted for phosphorylated S473 Akt and total Akt to confirm p-Akt level after transfection. (B) HCC1419 cells were transiently transfected with 1 μg pcDNA3 vector control (C) or pcDNA3-Akt-T308D/S473D constitutively active Akt plasmid. (C) JIMT-1 cells were transiently transfected with 1 μg pcDNA3 vector control (C) or pcDNA3-Akt-K179A kinase dead Akt plasmid. After 24 h transfection, cells were treated for an additional 72 h with DMSO, 10 μM lapatinib, 100 nM rapamycin, or a combination of 100 nM rapamycin plus 10 μM lapatinib. Viable cells were then counted by trypan blue exclusion. Viability is presented as a percentage of DMSO-treated control vector group, and reflects the average of 3 replicates per treatment group. Error bars represent standard deviation between replicates. P-values were determined by t-test for each treatment group in Akt-transfected cells versus corresponding treatment group in control-transfected cells; p=0.006 for lapatinib-treated constitutively active Akt-transfected HCC1419 cells versus lapatinib-treated vector control; p=0.01 for constitutively active Akt-transfected HCC1419 cells treated with combination lapatinib plus rapamycin versus treated with lapatinib alone; p=0.03 for lapatinib-treated, kinase-dead Akt-transfected JIMT-1 versus JIMT-1 lapatinib-treated vector control; no other statistically significant differences were found between treatment groups. Experiments were repeated at least twice with reproducible results.
Figure 4
Figure 4. Knockdown of 4EBP1 but not p70S6K improves lapatinib sensitivity
(A) JIMT-1 cells were transfected with 100 nM control siRNA (si-C) or p70S6K siRNA (si-p70) for 48 h. Total protein lysates were immunoblotted for total p70S6K and actin loading control to confirm knockdown. (B) JIMT-1 cells were transfected with 100 nM control siRNA (si-C) or p70S6K siRNA (si-p70) for 24 h, and then treated with DMSO control or 1 μM lapatinib (lap). After 72 h, viable cells were counted by trypan blue exclusion. Viability is presented as a percentage of DMSO-treated si-C group, and reflects the average of 3 replicates per treatment group. Error bars represent standard deviation between replicates. P-values were determined by t-test for p70 knockdown plus lapatinib versus si-C plus lapatinib. Experiments were repeated three times with reproducible results. (C) JIMT-1 cells were transfected with 100 nM control siRNA (si-C) or 4EBP1 siRNA (si-BP1) for 48 h. Total protein lysates were immunoblotted for total 4EBP1 and actin loading control to confirm knockdown. (D) JIMT-1 cells were transfected with 100 nM control siRNA (si-C) or 4EBP1 siRNA (si-4EBP1) for 24 h, and then treated with DMSO control or 1 μM lapatinib (lap). After 72 h, viable cells were counted by trypan blue exclusion. Viability is presented as a percentage of DMSO-treated si-C group, and reflects the average of 3 replicates per treatment group. Error bars represent standard deviation between replicates. P-values were determined by t-test for 4EBP1 knockdown plus lapatinib versus si-C plus lapatinib. Experiments were repeated three times with reproducible results.
Figure 5
Figure 5. Rapamycin increases lapatinib sensitivity of HER2-overexpressing breast cancer cells with primary trastuzumab resistance
(A) JIMT-1 and MDA361 cells were treated with rapamycin alone, lapatinib alone, or combination rapamycin plus lapatinib at indicated doses for 6 days. Proliferation was then measured by MTS assay. Values represent the average of 6 replicates per group as a percentage of DMSO-treated cells per treatment group. Error bars represent standard deviation between replicates. P-values were determined by t-test for each combination versus corresponding dose of lapatinib; *p<0.05, **p<0.005. Experiments were repeated twice with reproducible results. (B) JIMT-1 and MDA361 cells were plated in matrigel and treated with DMSO, 10 nM rapamycin (rapa), 1 μM lapatinib (Lp), or a combination of 10 nM rapamycin plus 1 μM lapatinib. Media plus drugs were changed every 3 days for approximately 3–4 weeks. Matrigel was dissolved with dispase, and viable cells were counted by trypan blue. Viability is shown as a percentage of the DMSO control group, and reflects an average of 3 replicates per treatment group. Error bars represent standard deviation between replicates. P-value was determined by t-test for combination treatment versus lapatinib alone; *p<0.05, **p<0.005. (C) MDA361 and JIMT-1 cells were treated with DMSO (C), 10 μM lapatinib (L), 100 nM rapamycin (R), or a combination of 100 nM rapamycin plus 10 μM lapatinib (LR) for 48 h, lysed for total protein, and immunoblotted for p-S473 Akt, total Akt, p-T389 p70S6K, total p70S6K, p-T202/Y204 Erk1/2, or total Erk1/2.
Figure 6
Figure 6. Efficacy of combination MK-8669 plus lapatinib in primary trastuzumab-resistant HER2-overexpressing breast cancer cells
(A) MDA361 and JIMT-1 cells were treated with 1 μM lapatinib (Lp), 10 nM MK-8669 (MK), or a combination of 1 μM lapatinib plus 10 nM MK-8669 for 6 days. Proliferation was then measured by MTS assay. Values represent the average of 6 replicates per group as a percentage of DMSO-treated cells. Error bars represent standard deviation between replicates. P-values were determined by t-test for combination treatments versus lapatinib alone for each cell line; *p<0.05. Experiments were repeated twice with reproducible results. (B) MDA361 and JIMT-1 cells were plated in matrigel and treated with 10 nM MK-8669, 1 μM lapatinib, or a combination of 10 nM MK-8669 plus 1 μM lapatinib. Media plus drugs were changed every 3 days for approximately 3–4 weeks. Matrigel was dissolved with dispase, and viable cells were counted by trypan blue. Viability is presented as a percentage of DMSO control group, and reflects an average of 3 replicates per treatment group. Error bars represent the standard deviation between replicates. P-value was determined by t-test for combination treatment versus lapatinib alone; *p<0.05. (C) JIMT-1 and MDA361 cells were treated with DMSO (C), 10 μM lapatinib (L), 100 nM MK-8669 (M), or a combination of 10 μM lapatinib plus 100 nM MK-8669 (LM) for 48 h, lysed for total protein, and immunoblotted for p-S473 Akt, total Akt, p-T389 p70S6K, total p70S6K, or actin loading control. (D) JIMT-1 cells were injected s.c. in the flank of athymic mice. After palpable tumors formed, tumors were treated daily (5 days on, 2 days off) with vehicle control (n=2), 75 mg/kg oral lapatinib (n=2), 1 mg/kg i.p. MK-8669 (n=2), or combination lapatinib plus MK-8669 (n=3). Mean tumor volume (x 100 mm3) is shown per treatment group, with error bars representing the standard deviation between replicates. P-value was determined by t-test for combination treatment versus lapatinib alone for each day that measurements were taken; *p<0.05.
Figure 7
Figure 7. Proposed model and summary
Lapatinib, a dual EGFR/HER2 kinase inhibitor, inhibits cell proliferation and survival in part by blocking PI3K/Akt/mTOR signaling. Based on our data, we propose that lapatinib is unable to block proliferation when PI3K/mTOR is not inhibited. Genetic or pharmacologic strategies that improved sensitivity to lapatinib (marked with an asterisk) included expression of dominant negative kinase-dead Akt, knockdown of 4EBP1, and mTOR inhibition by rapamycin or MK-8669. In contrast, knockdown of p70S6K alone did not increase the anti-proliferative activity of lapatinib.

Similar articles

Cited by

References

    1. Slamon DJ, Clark GM, Wong SG, Levin WJ, Ullrich A, McGuire WL. Human breast cancer: correlation of relapse and survival with amplification of the HER-2/neu oncogene. Science. 1987;235(4785):177–182. - PubMed
    1. Sorlie T, Perou CM, Tibshirani R, Aas T, Geisler S, Johnsen H, Hastie T, Eisen MB, van de Rijn M, Jeffrey SS, Thorsen T, Quist H, Matese JC, Brown PO, Botstein D, Eystein Lonning P, Borresen-Dale AL. Gene expression patterns of breast carcinomas distinguish tumor subclasses with clinical implications. Proc Natl Acad Sci U S A. 2001;98(19):10869–10874. - PMC - PubMed
    1. Cobleigh MA, Vogel CL, Tripathy D, Robert NJ, Scholl S, Fehrenbacher L, Wolter JM, Paton V, Shak S, Lieberman G, Slamon DJ. Multinational study of the efficacy and safety of humanized anti-HER2 monoclonal antibody in women who have HER2-overexpressing metastatic breast cancer that has progressed after chemotherapy for metastatic disease. J Clin Oncol. 1999;17(9):2639–2648. - PubMed
    1. Baselga J, Tripathy D, Mendelsohn J, Baughman S, Benz CC, Dantis L, Sklarin NT, Seidman AD, Hudis CA, Moore J, Rosen PP, Twaddell T, Henderson IC, Norton L. Phase II study of weekly intravenous recombinant humanized anti-p185HER2 monoclonal antibody in patients with HER2/neu-overexpressing metastatic breast cancer. J Clin Oncol. 1996;14(3):737–744. - PubMed
    1. Esteva FJ, Valero V, Booser D, Guerra LT, Murray JL, Pusztai L, Cristofanilli M, Arun B, Esmaeli B, Fritsche HA, Sneige N, Smith TL, Hortobagyi GN. Phase II study of weekly docetaxel and trastuzumab for patients with HER-2-overexpressing metastatic breast cancer. J Clin Oncol. 2002;20(7):1800–1808. - PubMed

Publication types

MeSH terms