

Self-report versus ultrasound measurement of uterine fibroid status
- PMID: 22044079
- PMCID: PMC3298676
- DOI: 10.1089/jwh.2011.3008
Self-report versus ultrasound measurement of uterine fibroid status
Abstract
Background: Much of the epidemiologic research on risk factors for fibroids, the leading indication for hysterectomy, relies on self-reported outcome. Self-report is subject to misclassification because many women with fibroids are undiagnosed. The purpose of this analysis was to quantify the extent of misclassification and identify associated factors.
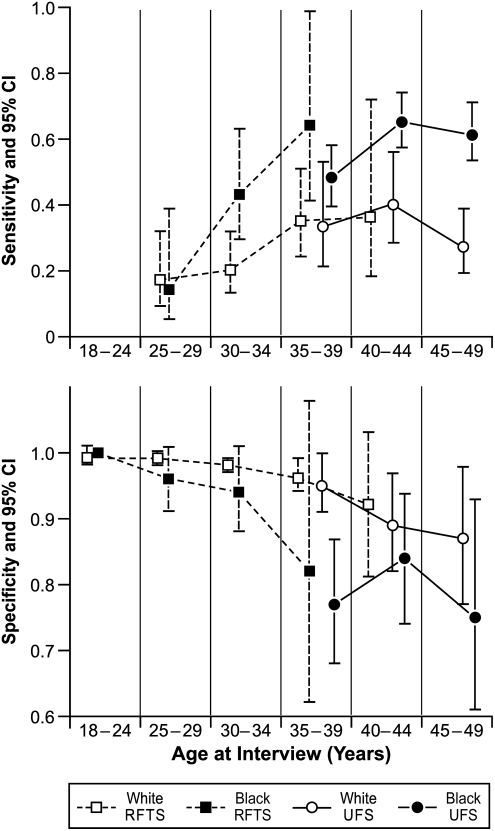
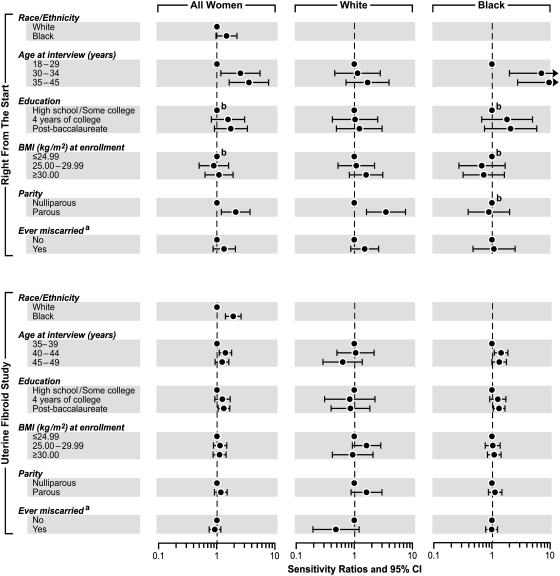
Methods: Self-reported fibroid status was compared to ultrasound screening from 2046 women in Right From The Start (RFTS) and 869 women in the Uterine Fibroid Study (UFS). Log-binomial regression was used to estimate sensitivity (Se) and specificity (Sp) and examine differences by ethnicity, age, education, body mass index, parity, and miscarriage history.
Results: Overall sensitivity was ≤0.50. Sensitivity was higher in blacks than whites (RFTS: 0.34 vs. 0.23; UFS: 0.58 vs. 0.32) and increased with age. Parous women had higher sensitivity than nulliparae, especially in RFTS whites (Se ratio=2.90; 95% confidence interval [CI]: 1.51, 5.60). Specificity was 0.98 in RFTS and 0.86 in UFS. Modest ethnic differences were seen in UFS (Sp ratio, black vs. white=0.90; 95% CI: 0.81, 0.99). Parity was inversely associated with specificity, especially among UFS black women (Sp ratio=0.84; 95% CI: 0.73, 0.97). Among women who reported a previous diagnosis, a shorter time interval between diagnosis and ultrasound was associated with increased agreement between the two measures.
Conclusions: Misclassification of fibroid status can differ by factors of etiologic interest. These findings are useful for assessing (and correcting) bias in studies using self-reported clinical diagnosis as the outcome measure.
Figures

References
-
- Baird DD. Dunson DB. Hill MC. Cousins D. Schectman JM. High cumulative incidence of uterine leiomyoma in black and white women: ultrasound evidence. Am J Obstet Gynecol. 2003;188:100–107. - PubMed
-
- Stewart EA. Uterine fibroids. Lancet. 2001;357:293–298. - PubMed
-
- Buttram VC., Jr Reiter RC. Uterine leiomyomata: etiology, symptomatology, and management. Fertil Steril. 1981;36:433–445. - PubMed
-
- Stovall DW. Clinical symptomatology of uterine leiomyomas. Clin Obstet Gynecol. 2001;44:364–371. - PubMed
Publication types
MeSH terms
Grants and funding
LinkOut - more resources
Full Text Sources
