Clinical Trial
. 2011 Dec 30;286(52):44503-11.
doi: 10.1074/jbc.M111.262915. Epub 2011 Nov 1.

miR-183-96-182 cluster is overexpressed in prostate tissue and regulates zinc homeostasis in prostate cells

Affiliations
Clinical Trial

miR-183-96-182 cluster is overexpressed in prostate tissue and regulates zinc homeostasis in prostate cells

Brittany L Mihelich et al. J Biol Chem. .

Abstract

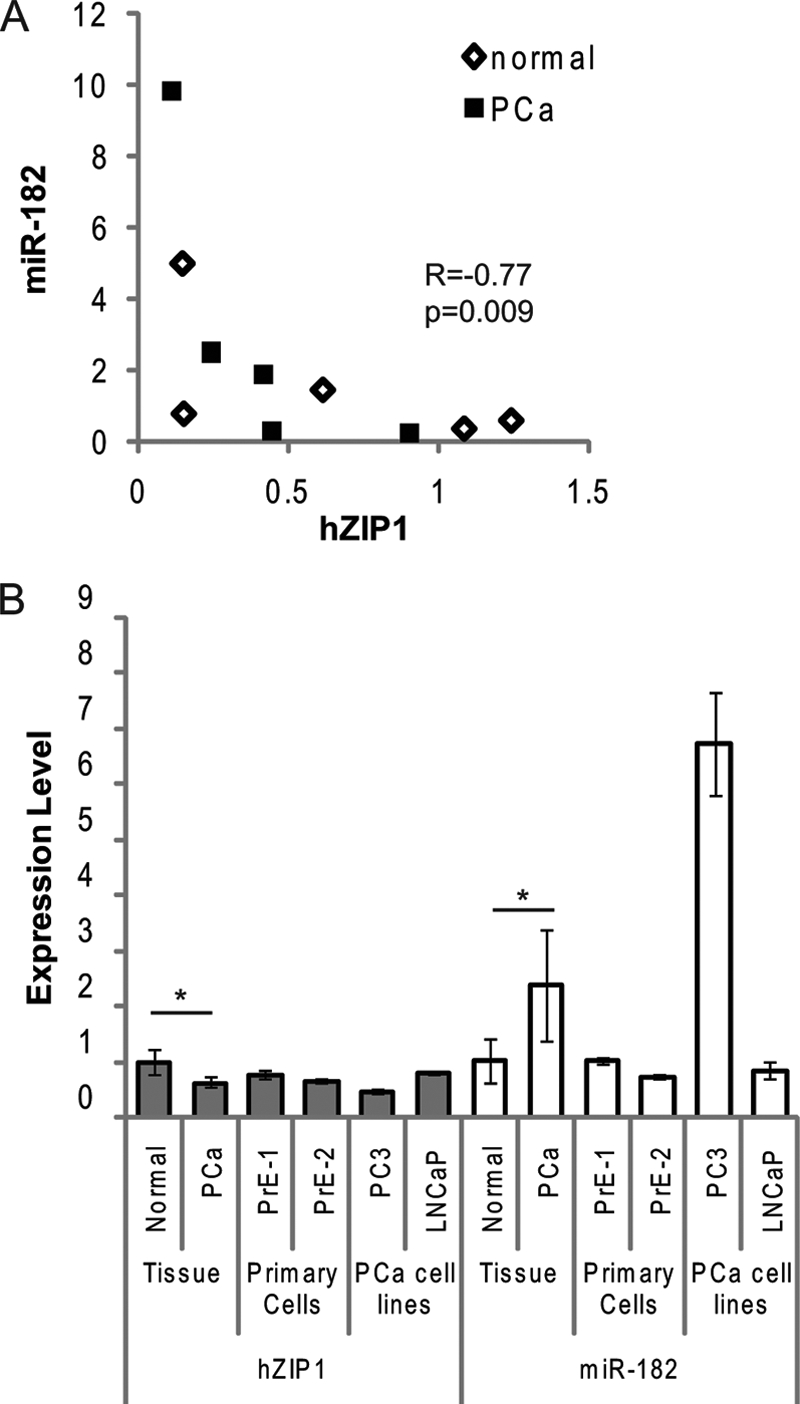
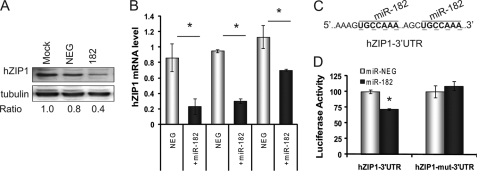
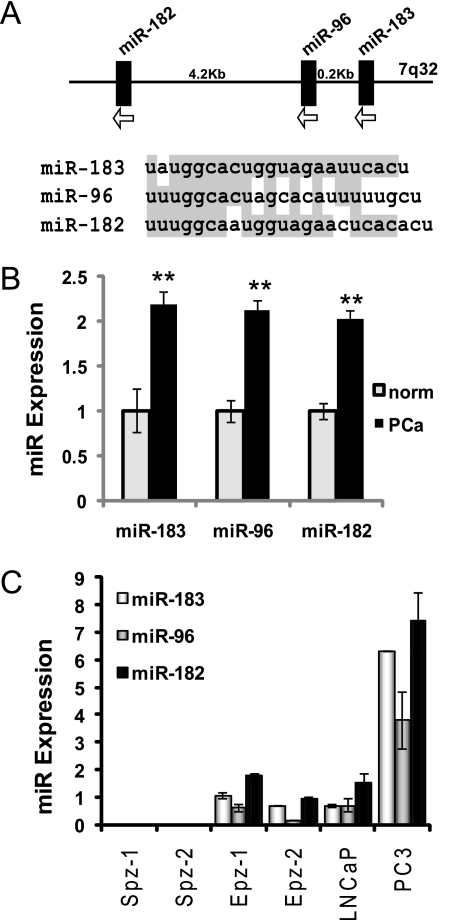
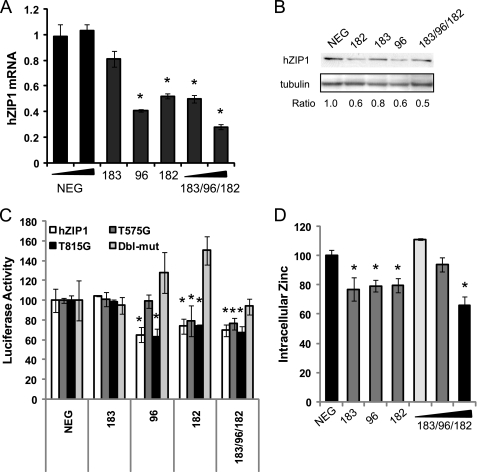
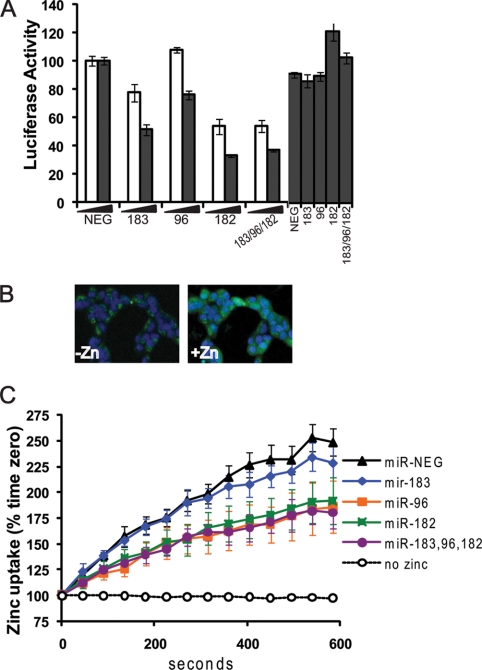
Decreased zinc levels are a hallmark of prostate cancer tumors as zinc uniquely concentrates in healthy prostate tissue. Increased dietary zinc correlates with decreased risk of advanced prostate cancer and decreased mortality from prostate cancer. The mechanisms of prostatic zinc homeostasis are not known. Lower zinc levels in the tumor are correlated directly with decreased expression of the zinc transporter hZIP1. We report identification of a microRNA cluster that regulates multiple zinc transporters, including hZIP1. Screening in laser capture microdissected prostate cancer tumors identified miR-182 as a potential regulator of hZIP1. Regulation of hZIP1 by miR-182 via two binding sites was confirmed in primary prostate cell cultures. miR-96 and miR-183 are expressed as a cluster with miR-182 and share similar sequences. Array profiling of tissue showed that miR-183, -96, and -182 are higher in prostate cancer tissue compared with normal prostate. Overexpression of the entire miR-183-96-182 cluster suppressed five additional zinc transporters. Overexpression of miR-183, -96, and -182 individually or as a cluster diminished labile zinc pools and reduced zinc uptake, demonstrating this miR cluster as a regulator of zinc homeostasis. We observed regulation of zinc homeostasis by this cluster in prostate cells and HEK-293 cells, suggesting a universal mechanism that is not prostate-specific. To our knowledge, this is the first report of a miR cluster targeting a family of metal transport proteins. Individually or as a cluster, miR-183, -96, and -182 are overexpressed in other cancers too, implicating this miR cluster in carcinogenesis.


Figures

FIGURE 1.
FIGURE 1.
hZIP1 and miR-182 levels in patient tissues and in primary human prostate epithelial cells. A, Spearman correlation between miR-182 and hZIP1 mRNA in LCM-collected patient prostate epithelial tissue samples measured by RT-qPCR. Relative levels of expression are on the axes, and the Spearman ρ and p value are shown (n = 10; five patients, normal (open diamonds) and PC (squares) tissue for each). Data shown are relative value to patient 1. B, RT-qPCR analysis of basal levels of hZIP1 mRNA and miR-182 in LCM-collected epithelium from PC (PCa) patients (n = 5), primary normal epithelial cells (PrE-1 and PrE-2, cells from two patients), and PC cell lines (PC3 and LNCaP). Data are shown relative to PrE-1. miR-182 normalized to RNU44 and hZIP1 normalized to GAPDH. *, p < 0.01 paired t test between the normal and cancer tissue. The graph is representative of three independent experiments, and error bars represent S.D. of technical duplicates.
FIGURE 2.
FIGURE 2.
Regulation of hZIP1 by miR-182 and validation of miR-182 binding sites in hZIP1 3′-UTR in normal PrE cells. A, immunoblot of hZIP1 protein in PrE cells 48 h following transfection with 50 nmol of pre-miR-182 or pre-miR-NEG (ratio to β-tubulin). B, hZIP1 mRNA in two PrE cell lines and in LNCaP prostate cancer cells 48 h following transfection with 50 nmol of pre-miR-182 or pre-miR-NEG. Results are shown relative value to pre-miR-NEG transfection. hZIP1 normalized to β2-microglobulin. Error bars represent S.D. of replicate experiments. C, predicted miR-182 binding sites in hZIP1 3′-UTR and site-directed mutagenesis locations (underlined in boldface type). D, luciferase activity of luc-hZIP1–3′-UTR or luc-hZIP1-mut-3′-UTR 24 h following co-transfection with prL-null, pre-miR-182 or pre-miR-NEG. Results were normalized to Renilla luciferase and shown as percentage of control. Error bars represent S.D. of replicate experiments. *, p < 0.05 paired t test. Results are representative of three or more independent experiments.
FIGURE 3.
FIGURE 3.
miR-183-96-182 cluster expression in prostate cells and patient tissue. A, miR-183-96-182 expressed as polycistronic RNA on chromosome 7 and sequence alignment for human miR-183, miR-96, and miR-182. B, miR-183, -96, and -182 expression in human prostate tissue by cDNA array. Graphs shows mean expression ± 95% confidence intervals for normal (norm) prostate (n = 11) and PC (PCa) tissue (n = 50). **, p < 10E-7 unpaired t test. Adaptation of data was by Martens-Uzunova et al. (25). C, basal levels of miR-183, miR-96, and miR-182 in human prostate cell cultures by RT-qPCR. Results shown relative to PrE-1 and normalized to RNU44 and RNU48. Error bars represent S.D. of duplicate experiments.
FIGURE 4.
FIGURE 4.
miR-183-96-182 cluster regulation of hZIP1 and intracellular zinc in primary prostate epithelial cells. hZIP1 mRNA (A) and protein (B) levels 24 h after transfection of miR-183, miR-96, or miR-182 in PrE cells. mRNA measured by RT-qPCR and protein by immunoblotting. Ratio to β-tubulin for immunoblot. C, luciferase activity of luc-hZIP1–3′-UTR or luc-hZIP1-mut-3′-UTR 24 h following co-transfection with prL-null, pre-miR-182 or pre-miR-NEG. Results were normalized to Renilla luciferase and shown as percentage of control. Error bars represent S.D. of replicate experiments. D, intracellular zinc in PrE cells 48 h following transfection with 15–50 nm pre-miR to miR-183, miR-96, and miR-182. Error bars are S.E. of three experiments. *, p < 0.05 paired t test.
FIGURE 5.
FIGURE 5.
miR-183-96-182 cluster regulates intracellular zinc uptake. A, luciferase activity of luc-hZIP1–3′-UTR or luc-hZIP1-mut-3′-UTR 24 h following co-transfection with prL-null, pre-miR-183, pre-miR-96, pre-miR-182, or pre-miR-NEG (nm of pre-miR indicated on x axis). Results were normalized to Renilla luciferase and shown as percentage of control. Error bars represent S.D. of replicate experiments. *, p < 0.05 paired t test. B, intracellular zinc in HEK-293 cells imaged with FluoZin-3 (green) and nuclei stained with Hoescht (blue) 0 and 3 min after adding 150 μm ZnSO4. C, quantification of zinc uptake by FluoZin-3 fluorescence in HEK-293 cells. Data collected every 45 s for 10 min and shown as percentage of time zero fluorescence. Zinc uptake measured 24 h following transfection with 50 nm pre-miR-NEG, pre-miR-183, pre-miR-96, or pre-miR-182. The no zinc line is a negative control to demonstrate no change in FluoZin-3 fluorescence in the absence of zinc. Data points represent the mean, and error bars represent S.E. of three independent experiments that each contained technical duplicates. *, p < 0.05 paired t test.

References

    1. Costello L. C., Franklin R. B., Feng P., Tan M., Bagasra O. (2005) Cancer Causes Control 16, 901–915 - PubMed
    1. Mawson C. A., Fischer M. I. (1952) Can J. Med. Sci. 30, 336–339 - PubMed
    1. Franklin R. B., Feng P., Milon B., Desouki M. M., Singh K. K., Kajdacsy-Balla A., Bagasra O., Costello L. C. (2005) Mol. Cancer 4, 32. - PMC - PubMed
    1. Habib F. K., Mason M. K., Smith P. H., Stitch S. R. (1979) Br. J. Cancer 39, 700–704 - PMC - PubMed
    1. Cortesi M., Fridman E., Volkov A., Shilstein SSh., Chechik R., Breskin A., Vartsky D., Kleinman N., Kogan G., Moriel E., Gladysh V., Huszar M., Ramon J., Raviv G. (2008) Prostate 68, 994–1006 - PubMed

Publication types