. 2012 Feb;91(2):299-309.
doi: 10.1189/jlb.0611308. Epub 2011 Nov 1.

Natural killer cell-produced IFN-γ and TNF-α induce target cell cytolysis through up-regulation of ICAM-1

Affiliations

Natural killer cell-produced IFN-γ and TNF-α induce target cell cytolysis through up-regulation of ICAM-1

Ruipeng Wang et al. J Leukoc Biol. 2012 Feb.

Abstract

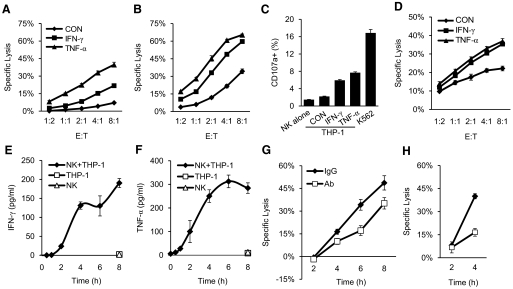
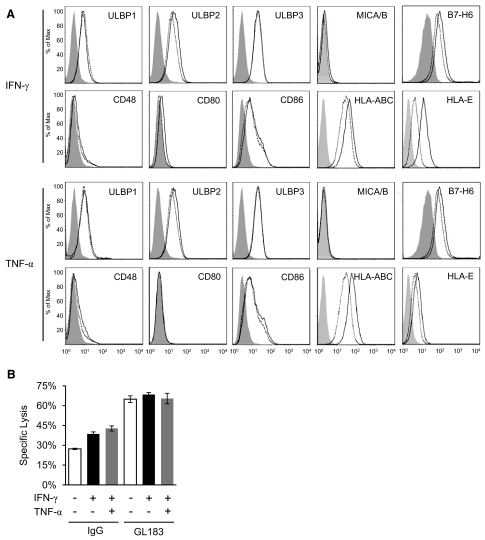
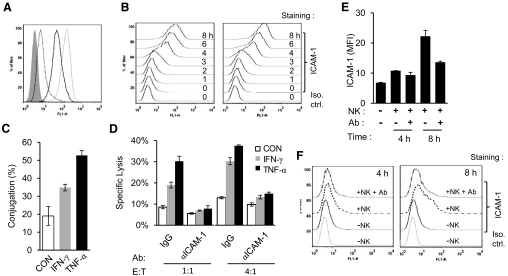
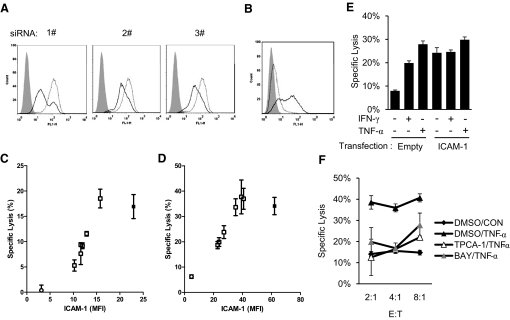
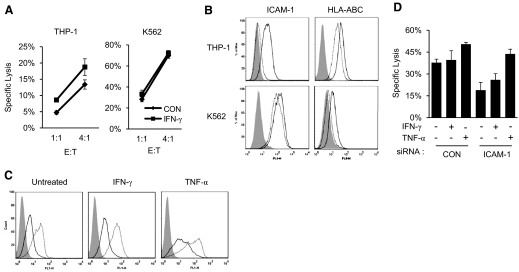
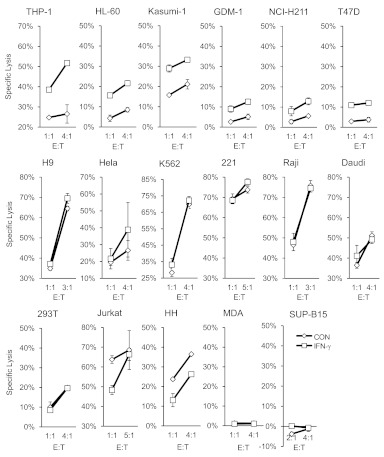
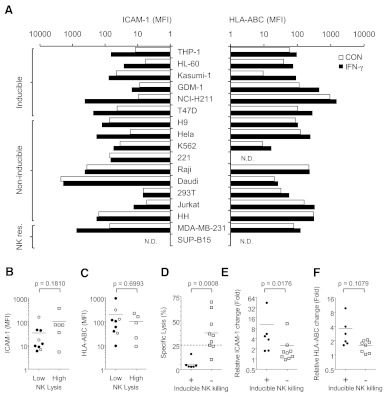
NK cells control tumor and virus-infected cells through releasing cytotoxic granules and proinflammatory cytokines. IFN-γ and TNF-α secretions and cytotoxicity are regarded as two distinct functions of NK cells with little synergy in between as results of early association of the two functions with distinct subsets of NK populations and of the studies showing target cells developing NK resistance upon IFN-γ treatment. Here, we show that IFN-γ and TNF-α synergistically enhance NK cell cytotoxicity through NF-κB-dependent up-regulation of ICAM-1 expression in target cells, thereby promoting their conjugate formation with NK cells. Neutralizing IFN-γ and TNF-α during cytolysis significantly impaired NK cell lysis of the target cells. Further, tumor cells exhibiting IFN-γ-inducible lysis are generally less-sensitive NK target cells but express inducible levels of ICAM-1. In contrast, sensitive NK targets tend to express higher but less-inducible ICAM-1. Their preferential induction in the lysis of insensitive NK target cells suggests that IFN-γ and TNF-α are functionally linked to and should be regarded as an integral part of NK cytolytic function.


Figures

Figure 1.
Figure 1.. IFN-γ- and TNF-α-induced lysis of THP-1 and Kasumi-1 cells by NK cells.
(A and B) Lysis of THP-1 (A) or Kasumi-1 (B) cells, with or without prior treatment of IFN-γ or TNF-α. IL-2 expanded, primary NK cells were used at the indicated E:T ratios. (C) Degranulation of NK-92MI cells alone and in the presence of untreated [control (CON)] and IFN-γ- or TNF-α-treated THP-1 cells. K562 cells were used as a positive control. (D) NK cell lysis of THP-1 cells treated with IFN-γ or TNF-α for 6 h. (E and F) Target cells mediated production of IFN-γ and TNF-α. Primary NK cells (105) were incubated with an equal number of THP-1 cells for the indicated time, and then the supernatants were collected for ELISA assays. (G and H) Lysis of THP-1 (G) and Kasumi-1 (H) cells by primary NK cells at an E:T ratio of 2:1 for the indicated time in the presence of neutralizing antibodies against IFN-γ and TNF-α or control IgG. The experiments were performed in triplicates, and the data were shown as mean ± sd from one of three experiments.
Figure 2.
Figure 2.. Change of NK ligands upon IFN-γ or TNF treatment.
(A) The expression of known ligands of activating NKRs and class I MHC molecules on THP-1 cells. Untreated (dotted lines), IFN-γ (50 ng/ml), or TNF-α (25 ng/ml) overnight-treated (black lines) THP-1 cells were stained with indicated antibodies and analyzed by flow cytometry. Isotype controls are shown in gray-shaded histograms. (B) Effect of inhibitory KIR on IFN-γ-induced lysis of THP-1. The cytotoxicity assays were carried out in the presence of a KIR-blocking antibody, GL183, or its isotype control using an E:T ratio of 8:1. The experiments were repeated for at least two times, and one representative result was shown.
Figure 3.
Figure 3.. ICAM-1 is required for IFN-γ- and TNF-α-induced target cell lysis.
(A) ICAM-1 expression on THP-1 cells (dotted line), THP-1 cells treated with IFN-γ (black line), or TNF-α (light, gray line) for 20 h. Isotype control (Iso. ctrl.) is shown in gray-shaded histograms. (B) The ICAM-1 expression on THP-1 cells was detected by FACS analysis at 0-, 1-, 2-, 3-, 4-, 6-, and 8-h time-points following the treatment with IFN-γ (left panel) or TNF-α (right panel). (C) IFN-γ and TNF-α enhanced the conjugation between NK and THP-1 cells. (D) Lysis of THP-1 cells by NK-92MI cells at an E:T ratio of 1:1 and 4:1 for 2 h in the presence of ICAM-1 blocking antibody or control IgG. (E and F) Coincubation of THP-1 cells with primary NK cells for 4 and 8 h increased ICAM-1 expression on THP-1 cells, and the ICAM-1 induction is reduced significantly in the presence of IFN-γ- and TNF-α-neutralizing antibodies. The same data were presented as a bar diagram (E) and histogram (F). The experiments were repeated for at least two times, and one representative result was shown. FL1-H, FL-1 height; MFI, mean fluorescence intensity.
Figure 4.
Figure 4.. The expression of ICAM-1 correlates with susceptibility to NK lysis.
(A) Knockdown of ICAM-1 on THP-1 cells with siRNA. TNF-α induced ICAM-1 expression on THP-1 cells transfected with control siRNA (dotted lines) or ICAM-1-specific siRNAs (black lines). Isotype control staining is shown in gray-shaded histograms. (B) ICAM-1 expression on empty vector-transfected (dotted line) or ICAM-1-transfected (black line) THP-1 cells. (C and D) Correlation between IFN-γ (C)- or TNF-α (D)-induced ICAM-1 expression on various siRNA-transfected THP-1 cells and their lysis by NK-92MI cells. (E) Overexpression of ICAM-1 is sufficient for THP-1 cells to sensitize to NK-92MI-mediated lysis. (F) TPCA-1 and BAY 11-7082 (BAY) inhibit TNF-α-induced sensitization of THP-1 cells to NK-92MI-mediated cytotoxicity. The experiments were repeated for at least two times, and one representative result was shown.
Figure 5.
Figure 5.. Basal levels of ICAM-1 determine target response to inducible NK lysis.
(A) Effects of IFN-γ on NK-92MI-mediated killing against THP-1 and K562 cells. (B) Expression of ICAM-1 and HLA-ABC on IFN-γ-treated (thick lines) and untreated (dotted lines) cells. The isotype controls are shown as gray-shaded histograms. ICAM-1 expression (C) on and NK lysis (D) of K562 cells transfected with (1#) siRNA against human ICAM-1 or universal high GC content control. The transfected cells were treated with or without IFN-γ (100 ng/ml) or TNF-α (50 ng/ml) for 20 h before FACS analysis and cytotoxicity assays using NK-92MI as effector cells at an E:T ratio of 1:1.
Figure 6.
Figure 6.. Effects of IFN-γ on NK-92MI lysis of multiple tumor cell lines using the indicated E:T ratio.
The experiments were performed in triplicates, and the data were shown as mean ± sd from one of at least two experiments. 221, 721.221; MDA, MDA-MB-231.
Figure 7.
Figure 7.. Distinct effects of IFN-γ on different tumor cell lines.
(A) Expression profiles of ICAM-1 and HLA-ABC on multiple tumor cell lines with or without IFN-γ treatment. NK res., NK resistance. (B) Comparison of basal levels of ICAM-1 on sensitive (high) and insensitive (low sensitivity) cytolytic target. (U=15.0; n1=9; n2=6; P=0.1810 two-tailed). (C) Comparison of basal levels of HLA-ABC on sensitive and insensitive cytolytic targets (U=19.0; n1=9; n2=5; P=0.6993 two-tailed). (D) Comparison of NK-mediated lysis of untreated-inducible and noninducible cells. The specific lysis of each target cell, based on the data from Fig. 6, at an E:T ratio of 1:1. The cutoff of sensitivity of NK lysis was shown as a dashed line. The distributions in the two groups differed significantly (U=1.0; n1=6; n2=9; P=0.0008 two-tailed). (E) Comparison of relative induction of ICAM-1 on inducible and noninducible cells. The distributions in the two groups differed significantly (U=7.0; n1=6; n2=9; P=0.0176 two-tailed). (F) Comparison of relative induction of HLA-ABC on inducible and noninducible cells (U=11.0; n1=6; n2=8; P=0.1079 two-tailed). The statistical analysis was done by Mann-Whitney U test using GraphPad Prism software. Inducible and noninducible target cells were shown as closed and open symbols, respectively.

References

    1. Biron C. A., Nguyen K. B., Pien G. C., Cousens L. P., Salazar-Mather T. P. (1999) Natural killer cells in antiviral defense: function and regulation by innate cytokines. Annu. Rev. Immunol. 17, 189–220 - PubMed
    1. Welsh R. M., Jr. (1978) Cytotoxic cells induced during lymphocytic choriomeningitis virus infection of mice. I. Characterization of natural killer cell induction. J. Exp. Med. 148, 163–181 - PMC - PubMed
    1. Grundy J. E., Trapman J., Allan J. E., Shellam G. R., Melief C. J. (1982) Evidence for a protective role of interferon in resistance to murine cytomegalovirus and its control by non-H-2-linked genes. Infect. Immun. 37, 143–150 - PMC - PubMed
    1. Gidlund M., Orn A., Wigzell H., Senik A., Gresser I. (1978) Enhanced NK cell activity in mice injected with interferon and interferon inducers. Nature 273, 759–761 - PubMed
    1. Trinchieri G., Santoli D., Koprowski H. (1978) Spontaneous cell-mediated cytotoxicity in humans: role of interferon and immunoglobulins. J. Immunol. 120, 1849–1855 - PubMed

Publication types

MeSH terms