. 2012 Jan;53(1):95-104.
doi: 10.1194/jlr.M018820. Epub 2011 Nov 1.

Cholesterol esterification by ACAT2 is essential for efficient intestinal cholesterol absorption: evidence from thoracic lymph duct cannulation

Affiliations

Cholesterol esterification by ACAT2 is essential for efficient intestinal cholesterol absorption: evidence from thoracic lymph duct cannulation

Tam M Nguyen et al. J Lipid Res. 2012 Jan.

Abstract

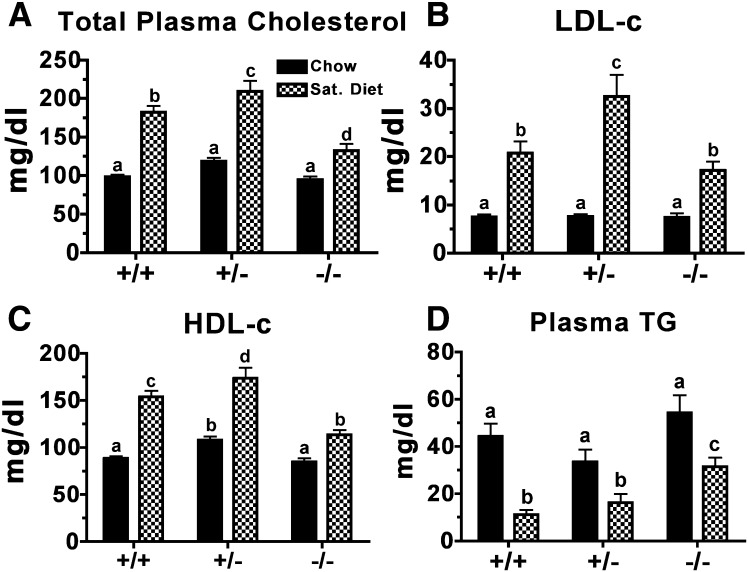
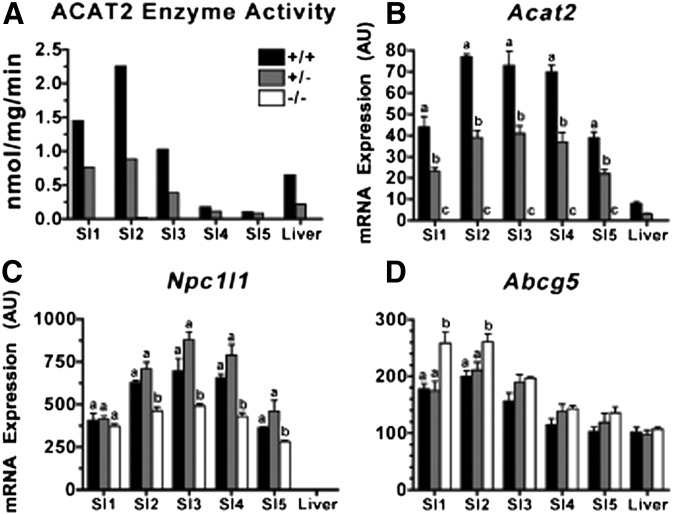
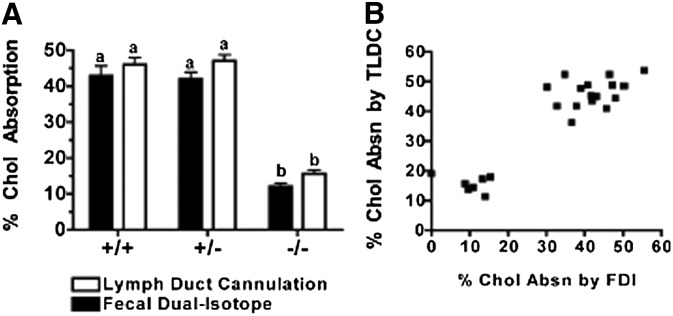
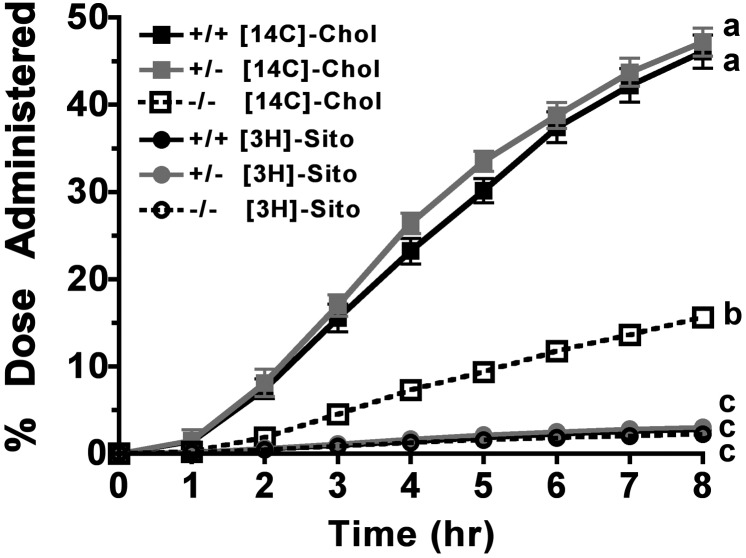
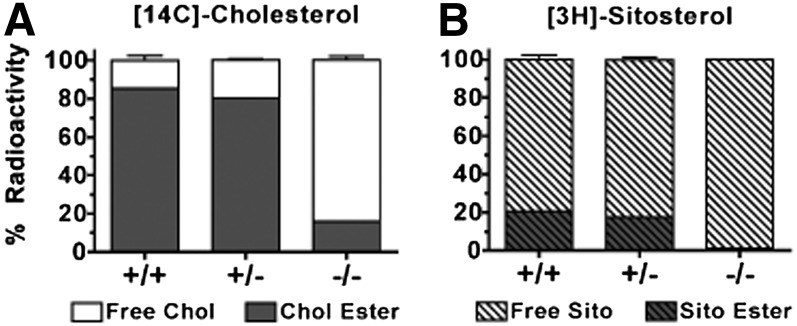
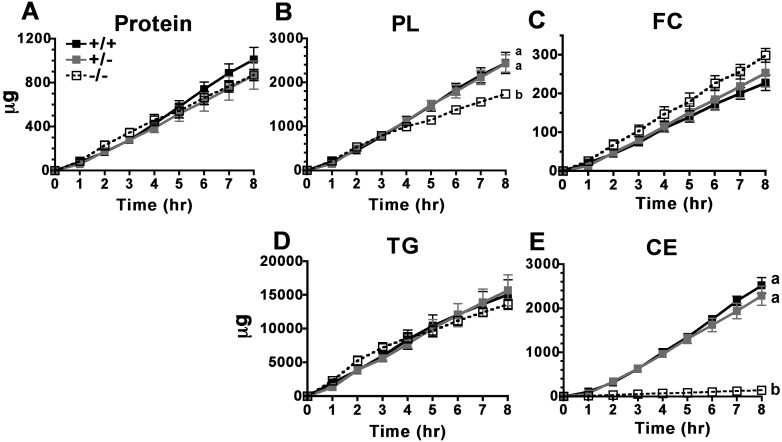
The hypothesis tested in this study was that cholesterol esterification by ACAT2 would increase cholesterol absorption efficiency by providing cholesteryl ester (CE) for incorporation into chylomicrons. The assumption was that absorption would be proportional to Acat2 gene dosage. Male ACAT2⁺/⁺, ACAT2⁺/⁻, and ACAT2⁻/⁻ mice were fed a diet containing 20% of energy as palm oil with 0.2% (w/w) cholesterol. Cholesterol absorption efficiency was measured by fecal dual-isotope and thoracic lymph duct cannulation (TLDC) methods using [³H]sitosterol and [¹⁴C]cholesterol tracers. Excellent agreement among individual mice was found for cholesterol absorption measured by both techniques. Cholesterol absorption efficiency in ACAT2⁻/⁻ mice was 16% compared with 46-47% in ACAT2⁺/⁺ and ACAT2⁺/⁻ mice. Chylomicrons from ACAT2⁺/⁺ and ACAT2⁺/⁻ mice carried ∼80% of total sterol mass as CE, whereas ACAT2⁻/⁻ chylomicrons carried >90% of sterol mass in the unesterified form. The total percentage of chylomicron mass as CE was reduced from 12% in the presence of ACAT2 to ∼1% in ACAT2⁻/⁻ mice. Altogether, the data demonstrate that ACAT2 increases cholesterol absorption efficiency by providing CE for chylomicron transport, but one copy of the Acat2 gene, providing ∼50% of ACAT2 mRNA and enzyme activity, was as effective as two copies in promoting cholesterol absorption.


Figures

Fig. 1.
Fig. 1.
Diet effects on plasma cholesterol and triglyceride concentrations in male ACAT2+/+, ACAT2+/−, and ACAT2−/− mice. Plasma was collected after centrifugation of blood from mice fed rodent chow and two weeks of saturated fat diet (20% of energy as palm oil and 0.2% (w/w) cholesterol). (A) Total plasma cholesterol concentrations measured using the cholesterol/HP enzymatic reagents from Roche Diagnostics. (B) LDL cholesterol and (C) HDL cholesterol concentrations determined by gel filtration chromatography. (D) Triglyceride concentrations measured using reagents from Wako Chemicals. Data represent mean ± SEM (n = 8–13/genotypes). Data were analyzed by two-way ANOVA with Bonferroni posthoc tests. Different letters designate statistically significant differences (P < 0.05).
Fig. 2.
Fig. 2.
Impact of Acat2 gene dosage on ACAT2 enzyme activity and Acat2, Npc1l1, and Abcg5 mRNA expression in five segments of small intestine (SI) compared with liver. (A) Microsomal ACAT2 activity of tissue pools (n = 5/genotype). (B) Acat2, (C) Npc1l1, and (D) Abcg5 mRNA expression from individual samples are expressed as mean ± SEM (n = 5/genotype). All values for mRNA expressions are arbitrary units (AU) derived from real-time-PCR data normalized to mRNA expression of cyclophilin, a housekeeping gene, within the same sample. Different letters designate statistically significant differences (P < 0.05) within the same tissue, as measured by two-way ANOVA and Bonferroni posthoc tests.
Fig. 3.
Fig. 3.
Measurement of cholesterol absorption efficiency by FDI and TLDC. (A) Estimation of percentage cholesterol absorption by FDI method was derived from extraction of crushed feces collected for three days; direct measurement of percentage cholesterol absorption by TLDC was reported as the percentage of total [14C]cholesterol dose recovered in lymph after 8 h collection. See Materials and Methods for details. Data are expressed as mean ± SEM (n = 7–9/genotype). Different letters designate statistically significant differences (P < 0.05) as measured by two-way ANOVA and Bonferroni posthoc tests. (B) Percent cholesterol absorption values derived from FDI and TLDC methods for 24 individual animals.
Fig. 4.
Fig. 4.
Cumulative radioactive sterol appearance in thoracic duct lymph. Using a dual-channel isotope scintillation spectrometer, [14C]cholesterol and [3H]sitosterol disintegrations per minute were measured in aliquots of whole lymph from hourly collections. Data are expressed as percentage of accumulated radioactive sterol dose recovered in collected lymph for each animal and represent mean ± SEM (n = 7–9/genotype). Different letters denote statistically significant differences (P < 0.05) at 8 h as measured by two-way ANOVA and Bonferroni posthoc tests.
Fig. 5.
Fig. 5.
Relative percentage of radioactivity in chylomicron free sterols and sterol esters. Total lipid extracts of isolated chylomicrons were separated by thin-layer chromatography into free sterols and sterol esters. (A) Relative percentage of [14C]cholesterol in free sterol and sterol esters. (B) Relative percentage of [3H]sitosterol in free sterol and sterol esters. Data represent mean ± SEM (n = 5/genotype).
Fig. 6.
Fig. 6.
Cumulative chylomicron particle mass appearance over 8 h. Isolated chylomicrons were assayed for micrograms of (A) protein, (B) phospholipids, (C) free cholesterol, (D) triglyceride, and (E) cholesteryl ester per hourly collection of lymph. Data are expressed as mean ± SEM (n = 5/genotype). Different letters denote statistically significant differences (P < 0.05) as measured by two-way ANOVA and Bonferroni posthoc tests.
Fig. 7.
Fig. 7.
Chylomicron particle size. Mean diameter of chylomicrons isolated from hour 3 and hour 4 lymph collections measured separately by dynamic light scattering (Zetasizer) and then averaged together. Data represent mean ± SEM (n = 5–8/genotype). No statistically significant difference (P < 0.05) was found by one-way ANOVA.
Fig. 8.
Fig. 8.
Apolipoproteins of isolated chylomicron particles. Representative gel image of apolipoproteins on chylomicrons isolated from hour 3 lymph collection (n = 2/genotype). TCA-precipitated chylomicron proteins were separated on 4–20% SDS-PAGE gel and Coomassie stained for visualization.

References

    1. Rosamond W., Flegal K., Furie K., Go A., Greenlund K., Haase N., Hailpern S. M., Ho M., Howard V., Kissela B., et al. 2008. Heart disease and stroke statistics--2008 update: a report from the American Heart Association Statistics Committee and Stroke Statistics Subcommittee. Circulation. 117: e25–e146. - PubMed
    1. Kannel W. B., Castelli W. P., Gordon T., McNamara P. M. 1971. Serum cholesterol, lipoproteins, and the risk of coronary heart disease. The Framingham study. Ann. Intern. Med. 74: 1–12. - PubMed
    1. Wang D. Q. 2007. Regulation of intestinal cholesterol absorption. Annu. Rev. Physiol. 69: 221–248. - PubMed
    1. McMurry M. P., Connor W. E., Lin D. S., Cerqueira M. T., Connor S. L. 1985. The absorption of cholesterol and the sterol balance in the Tarahumara Indians of Mexico fed cholesterol-free and high cholesterol diets. Am. J. Clin. Nutr. 41: 1289–1298. - PubMed
    1. Iqbal J., Hussain M. M. 2009. Intestinal lipid absorption. Am. J. Physiol. Endocrinol. Metab. 296: E1183–E1194. - PMC - PubMed

Publication types