

doi: 10.1101/pdb.top066662.
Optical traps to study properties of molecular motors
- PMID: 22046048
- PMCID: PMC4784437
- DOI: 10.1101/pdb.top066662
Item in Clipboard
Optical traps to study properties of molecular motors
Cold Spring Harb Protoc.
.
Abstract
In vitro motility assays enabled the analysis of coupling between ATP hydrolysis and movement of myosin along actin filaments or kinesin along microtubules. Single-molecule assays using laser trapping have been used to obtain more detailed information about kinesins, myosins, and processive DNA enzymes. The combination of in vitro motility assays with laser-trap measurements has revealed detailed dynamic structural changes associated with the ATPase cycle. This article describes the use of optical traps to study processive and nonprocessive molecular motor proteins, focusing on the design of the instrument and the assays to characterize motility.
Figures

Schematic illustrations of in vitro assays and myosin VI. (Left) Illustrations of an in vitro motility assay (Kron and Spudich 1986) (above) and a single-molecule laser-trap assay (Finer et al. 1994) derived from it (below). In both cases, myosin is coated on a glass coverslip and fluorescent actin filaments move on the myosin molecules. For the laser-trap assay, platforms (~1-μm glass beads) are adhered to the coverslip to elevate single myosin molecules for interaction with actin that is held in suspension with dual-laser traps, each holding a 1-μm polystyrene bead attached to the end of the actin filament. (Right) Illustration of the prestroke state of myosin VI derived from in vitro motility and laser-trap single-molecule analyses (Bryant et al. 2007) and the known poststroke structure of myosin VI (Ménétrey et al. 2005). The (−) end directionality of the motor is clearly derived from the unique insert and its bound calmodulin (orange and purple regions), an element of the lever arm not present in myosins II and V. Going from the prestroke state to the poststroke state, the carboxy-terminal end of the lever arm (blue) moves in the (−) end direction of the actin filament (to the right), whereas the converter domain (green) moves in the (+) end direction, like myosins II and V.

Optical trap design. For the purposes of drawing ray optics of the laser light in this diagram, it is assumed that the lenses are thin. The Nd:YAG trapping laser (Coherent Compass 1064-2000) is shown on the left, and the laser beam emitting from it is shown as a black line. Most of the power is split off by the λ/2 waveplate (λ/2) and polarizing beam splitter (pol b/s) to a beam dump. After a threefold expansion, the beam is deflected by the orthogonal AODs. Only the original beam and one deflected beam are shown, although in reality four different major beams come out of the pair of AODs. The deflected beams are selected by an aperture at the focal length of lens L1 (described in text). Lenses L1 and L2 serve as a second threefold telescope, which expands the beam sufficiently to fill the back aperture of the objective lens (L3). The laser light is reflected up to the objective by a dichroic mirror (M1), which is also used to adjust the position and tilt of the optical trap in the sample plane for a coarse alignment. For the dual-beam trap shown in Figure 1 (left), there are two independent ray traces, only one of which is shown here. In that case, each trapping beam is independently governed by its own set of orthogonal AODs.
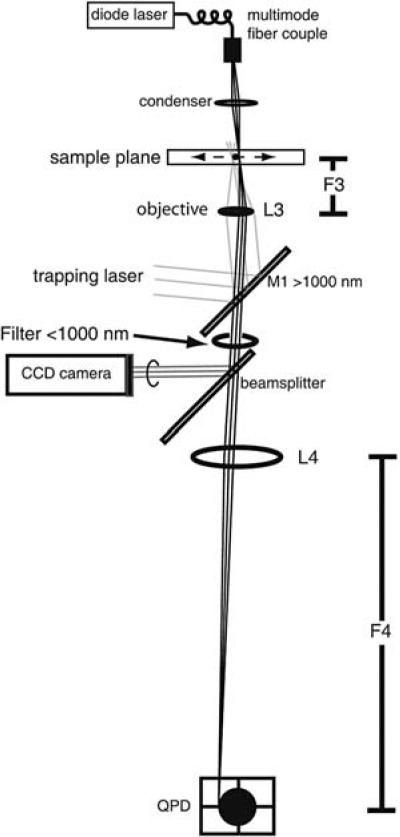
Tracking of bead movements on a QPD detector. A setup for imaging a 1-μm bead onto the QPD detector is shown. For simplicity, the figure is drawn assuming that lenses are thin. A diode laser at 800 nm (Laser Diode, Inc. LCW-200F, 500 mW output) coupled into a multiple mode fiber and pumped just below its lasing threshold is used for a high brightness light source introduced through the condenser. The image of the bead passes through the objective lens and the dichroic mirror (M1). A <1000-nm filter blocks out any trapping laser light that is back-reflected off the water-glass interface in the sample. A beam splitter diverts a small amount of the incoming light to the CCD camera for bright-field imaging. L4 magnifies the image of the bead onto the QPD, which is set up one focal length away from L4, for nanometer precision positioning of the trapped bead. In the dual-beam trap shown in Figure 1 (left), both actin-attached beads are independently imaged on two different QPDs. The trace shown here is simplified to illustrate one such imaging.

Alignment of the optical trap. Shown is a schematic illustration of a setup that enables alignment of the trap in the sample plane using the CCD camera to image the back reflection of the trapping light off the glass–water interface. Because the cutoff of the dichroic mirror is 1000 nm, a small amount of the trapping laser light (1064 nm) is transmitted through it, and this is imaged onto the CCD camera at high sensitivity.

Myosin V stepping using a force clamp. (Red trace) Unfiltered data of the position of a trapped polystyrene bead (Rief et al. 2000); (black trace) position of the trap following the bead to maintain constant load. Data were taken at 3 μm ATP.
References
-
- Ashkin A. Forces of a single-beam gradient laser trap on a dielectric sphere in the ray optics regime. Methods Cell Biol. 1998;55:1–27. - PubMed
-
- Berg-Sorensen K, Flyvbjerg H. Power spectrum analysis for optical tweezers. Rev Sci Instrum. 2004;75:594–612.
-
- Berg-Sorensen K, Oddershede L, Florin E-L, Flyvbjerg H. Unintended filtering in a typical photodiode detection system for optical tweezers. J Appl Phys. 2003;93:3167–3176.
-
- Berg-Sorensen K, Peterman EJG, Weber T, Schmidt CF, Flyvbjerg H. Power spectrum analysis for optical tweezers. II. Laser-wavelength dependence of parasitic filtering and how to achieve high bandwidth. Rev Sci Instrum. 2006;77:063106–1–063106-11.
-
- Berns MW, Aist JR, Wright WH, Liang H. Optical trapping in animal and fungal cells using a tunable, near-infrared titanium-sapphire laser. Exp Cell Res. 1992;198:375–378. - PubMed
Publication types
MeSH terms
Substances
Grants and funding
LinkOut - more resources
Full Text Sources