. 2011;6(10):e24777.
doi: 10.1371/journal.pone.0024777. Epub 2011 Oct 26.

Elevated stearoyl-CoA desaturase in brains of patients with Alzheimer's disease

Affiliations

Elevated stearoyl-CoA desaturase in brains of patients with Alzheimer's disease

Giuseppe Astarita et al. PLoS One. 2011.

Abstract

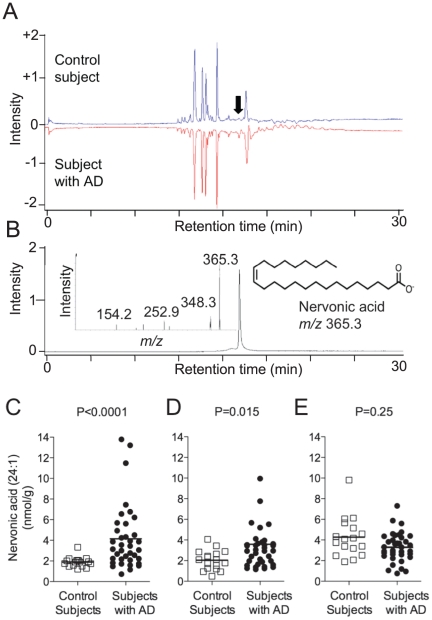
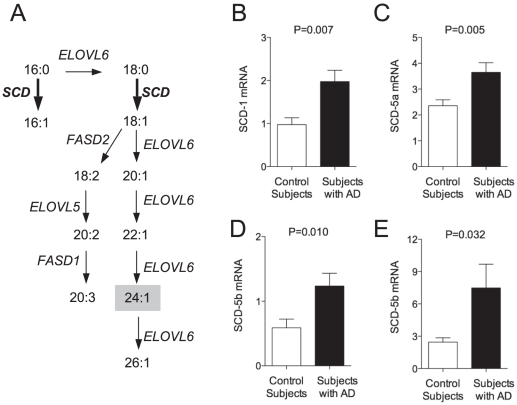
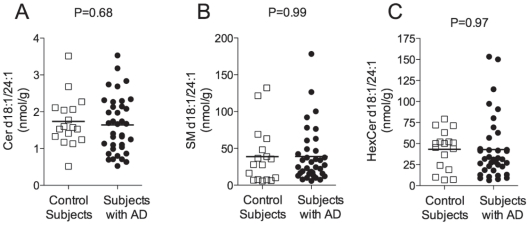
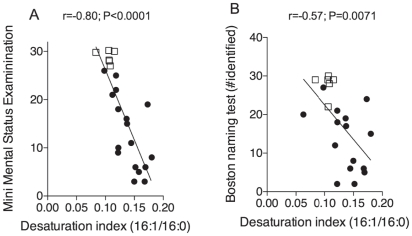
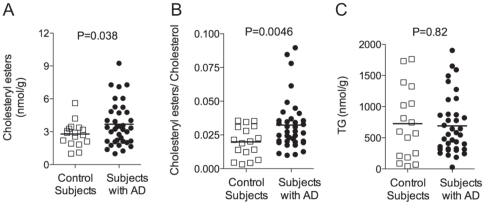
The molecular bases of Alzheimer's disease (AD) remain unclear. We used a lipidomic approach to identify lipid abnormalities in the brains of subjects with AD (N = 37) compared to age-matched controls (N = 17). The analyses revealed statistically detectable elevations in levels of non-esterified monounsaturated fatty acids (MUFAs) and mead acid (20:3n-9) in mid-frontal cortex, temporal cortex and hippocampus of AD patients. Further studies showed that brain mRNAs encoding for isoforms of the rate-limiting enzyme in MUFAs biosynthesis, stearoyl-CoA desaturase (SCD-1, SCD-5a and SCD-5b), were elevated in subjects with AD. The monounsaturated/saturated fatty acid ratio ('desaturation index')--displayed a strong negative correlation with measures of cognition: the Mini Mental State Examination test (r = -0.80; P = 0.0001) and the Boston Naming test (r = -0.57; P = 0.0071). Our results reveal a previously unrecognized role for the lipogenic enzyme SCD in AD.


Conflict of interest statement

Competing Interests: The authors have declared that no competing interests exist.

Figures

Figure 1
Figure 1. Untargeted lipidomic analyses.
Representative mirror-display images and differential LC/MS analysis of lipids from a subject with AD and a control subject. The component detected as being qualitatively different between the two samples (Panel A, arrow), was subsequently identified as nervonic acid, using LC/MS2 (Panel B). Quantitative measures of nervonic acid in mid-frontal cortex (Panel C), temporal cortex (Panel D) and cerebellum (Panel E) from control subjects (open squares) and AD patients (closed circles). Two-tailed Welch's t-test.
Figure 2
Figure 2. Overview of MUFAs biosynthesis and levels of SCD mRNA in the brain of subjects with AD and control subjects.
Palmitic acid (16:0) is transformed into palmitoleic acid (16:1n-7) by the action of SCD (Panel A). Palmitic acid can also be transformed into stearic acid (18:0) by elongase activity (such as those encoded by ELOVL genes) and subsequently into oleic acid (18:1) by SCD activity (Panel A). Oleic acid can be then converted into longer chain fatty acids by sequential action of elongases and Δ5 and Δ6 desaturases (encoded by the FASD1 and FASD2 genes, respectively, Panel A). Levels of mRNA for SCD-1 (Panel B), SCD-5a (Panel C) and SCD-5b (Panel D) in hippocampus and SCD-5b (Panel E) in mid-frontal cortex from control subjects (N = 17, open squares) and AD patients (N = 28, closed circles). Two-tailed Welch's t-test.
Figure 3
Figure 3. Levels of nervonic acid-containing lipids in the brain of subjects with AD and control subjects.
Levels of ceramide d18:1/24:1 (Panel A), sphingomyelin d18:1/24:1 (Panel B), hexosylceramide d18:1/24:1 (Panel C) in mid-frontal cortex from control subjects (N = 17, open squares) and AD patients (N = 37, closed circles). Two-tailed Welch's t-test.
Figure 4
Figure 4. Correlation between brain MUFA levels and cognitive function in subjects with AD and control subjects.
Correlation between desaturation index (16:1/16:0) in mid-frontal cortex and most recent neuropsychometric scores from control subjects (open squares) and subjects with AD (closed circles). There were significant correlations between individual desaturation indices and available Mini-Mental State Examination scores (Panel A) and Boston Naming Test scores (Panel B). Partial correlation analysis after adjustment for age, gender and post mortem interval.
Figure 5
Figure 5. Levels of cholesteryl esters and TG in the brain of subjects with AD and control subjects.
Levels of total cholesteryl esters (Panel A), cholesteryl esters to cholesterol ratio (Panel B) and total TGs (Panel C) in mid-frontal cortex from control subjects (N = 17, open squares) and AD patients (N = 37, closed circles). Two-tailed Welch's t-test.

References

    1. Querfurth HW, LaFerla FM. Alzheimer's disease. N Engl J Med. 2010;362:329–344. - PubMed
    1. Prince M, Jackson J International AsD, editor. London: 2009. World Alzheimer Report.
    1. Finch CE. Developmental origins of aging in brain and blood vessels: an overview. Neurobiol Aging. 2005;26:281–291. - PubMed
    1. Launer LJ. The epidemiologic study of dementia: a life-long quest? Neurobiol Aging. 2005;26:335–340. - PubMed
    1. Whalley L, Dick F, McNeill G. A life-course approach to the aetiology of late-onset dementias. Lancet Neurology. 2006;5:87–96. - PubMed

Publication types

Associated data