. 2011;6(10):e26272.
doi: 10.1371/journal.pone.0026272. Epub 2011 Oct 26.

Oscillatory dynamics of cell cycle proteins in single yeast cells analyzed by imaging cytometry

Affiliations

Oscillatory dynamics of cell cycle proteins in single yeast cells analyzed by imaging cytometry

David A Ball et al. PLoS One. 2011.

Abstract

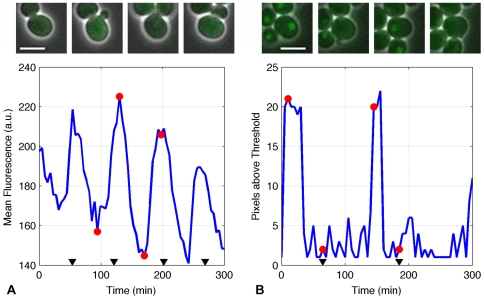
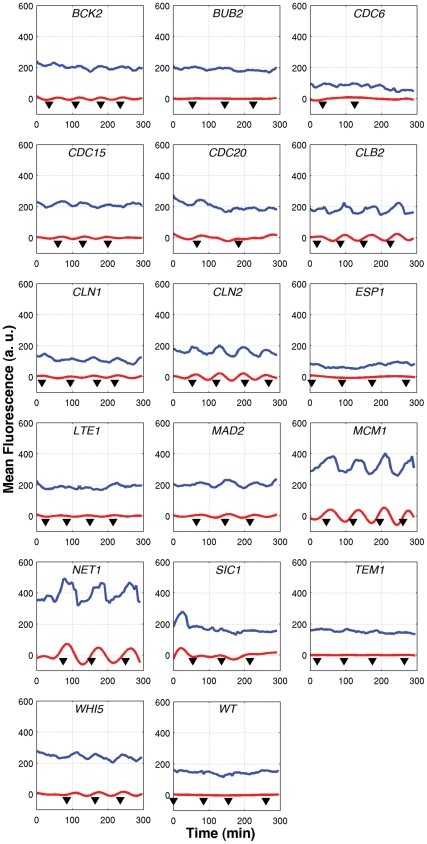
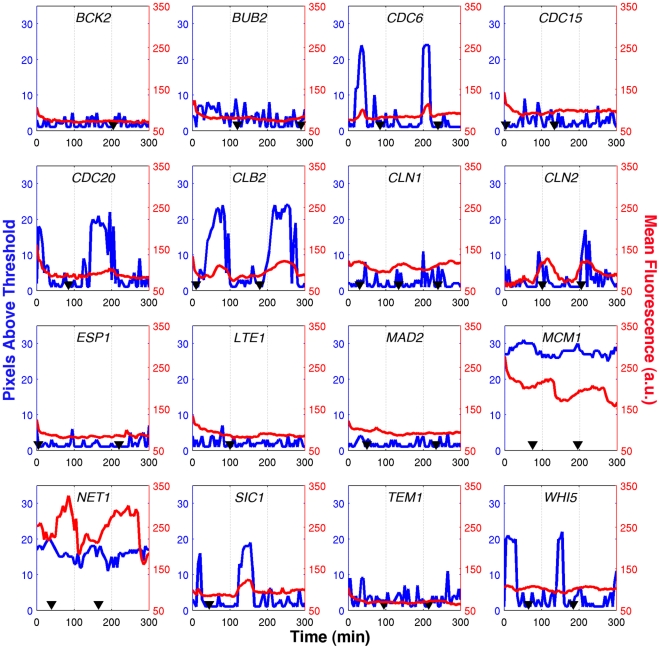
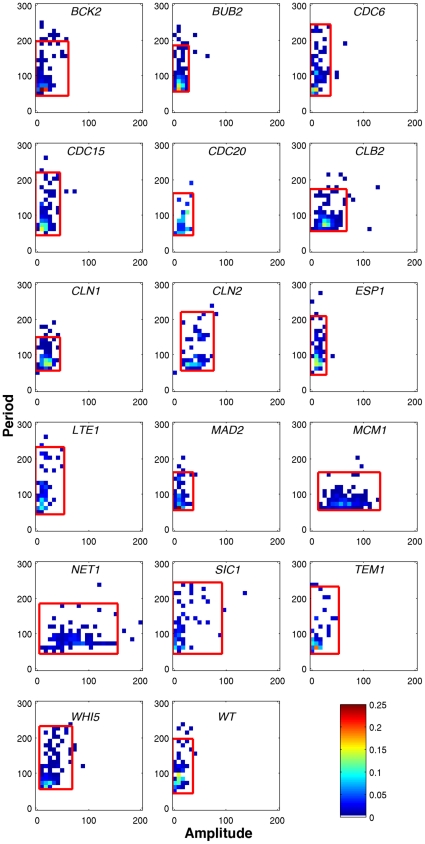
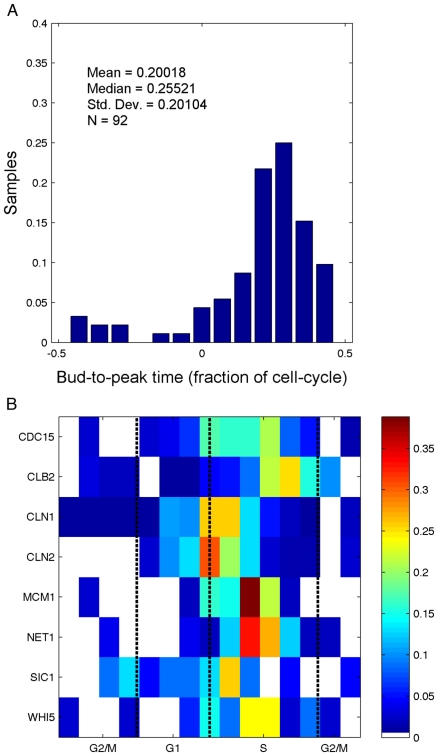
Progression through the cell division cycle is orchestrated by a complex network of interacting genes and proteins. Some of these proteins are known to fluctuate periodically during the cell cycle, but a systematic study of the fluctuations of a broad sample of cell-cycle proteins has not been made until now. Using time-lapse fluorescence microscopy, we profiled 16 strains of budding yeast, each containing GFP fused to a single gene involved in cell cycle regulation. The dynamics of protein abundance and localization were characterized by extracting the amplitude, period, and other indicators from a series of images. Oscillations of protein abundance could clearly be identified for Cdc15, Clb2, Cln1, Cln2, Mcm1, Net1, Sic1, and Whi5. The period of oscillation of the fluorescently tagged proteins is generally in good agreement with the inter-bud time. The very strong oscillations of Net1 and Mcm1 expression are remarkable since little is known about the temporal expression of these genes. By collecting data from large samples of single cells, we quantified some aspects of cell-to-cell variability due presumably to intrinsic and extrinsic noise affecting the cell cycle.


Conflict of interest statement

Competing Interests: The authors have declared that no competing interests exist.

Figures

Figure 1
Figure 1. Indicators of protein abundance and protein localization.
(A) Comparison between Cln2-GFP images and indication of protein abundance. Here the cell in the center of the image exhibits a noticeable difference in cell fluorescence between images 1 and 3 (low) and images 2 and 4 (high). (B) Comparison between Whi5-GFP images and the indicator of protein localization. On images 1 and 3, when looking at the cell in the center of the images, it is possible to recognize a subcellular structure where more fluorescence is concentrated than in the other regions of the cells. In both parts, the top of the figure shows four images taken over two cell cycles, while the bottom of the figure shows the indicator of protein abundance (A) or fluorescence localization (number of pixels above the threshold) (B). The red circles correspond to the time-points of the four images. The black triangles indicate budding events. The scale bars in the images indicate 5 µm.
Figure 2
Figure 2. Mean cell fluorescence for individual cells.
The measured mean fluorescence is plotted (blue line) along with the filtered signal (red line) for a single cell expressing GFP as a fusion with the indicated cell-cycle regulator. Filtering removes all high-frequency noise, as well as the DC offset, leaving signals that have a zero mean. Budding events are indicated by black triangles.
Figure 3
Figure 3. Localization of GFP-tagged proteins.
Z-stacks of cells expressing a GFP fusion of the indicated protein were projected to a single image and analyzed to determine changes in localization through the cell cycle. The number of connected pixels within the 95th percentile (blue curve) was used as a metric to calculate the degree of localization, with a higher number indicating a larger area of bright pixels. A typical cell from each strain is shown, along with that cell's mean fluorescence over the entire cell (red curve) and the manually annotated budding events (black triangles). Note that the increased light exposure (∼20×) resulted in much slower cell-division compared to the single-plane experiments described.
Figure 4
Figure 4. Distributions of amplitude and period estimates for gene expression for 16 GFP-tagged strains and WT.
Red boxes enclose 95% of all cells. Low-pass Butterworth filtering removes all oscillations with non-physiological periods, which leaves only periods greater than 50 min. Using a t-test, we compared the amplitude distribution (x-axis) for each strain with that of wild-type (wt) cells to determine if the protein level exhibits noticeable oscillations. The color of each bin represents the fraction of cell cycles that fall in that bin, indicated by the colorbar in the lower right.
Figure 5
Figure 5. Phase of peak expression in cell-cycle normalized time.
(A) Distribution of the time between bud emergence and peak fluorescence for the CLB2-GFP strain. (B) Distributions of all GFP-tagged strains, with color representing fraction of cells comparable to the height of each bin displayed in (A). Cell-cycle stages are based on the relative length of each stage from , and assuming that bud emergence occurs at the G1-S transition. The boundaries between the different stages are represented by the dashed vertical lines. Because of the difficulty in identifying all budding events, the bud-to-peak time value is found by locating the closest peak in the fluorescence time-course to each identified budding event.

Similar articles

Cited by

References

    1. Morgan DO. The cell cycle : principles of control. London: New Science Press, Ltd; 2007.
    1. Barik D, Baumann WT, Paul MR, Novak B, Tyson JJ. A model of yeast cell-cycle regulation based on multisite phosphorylation. Mol Syst Biol. 2010;6:405. - PMC - PubMed
    1. Kar S, Baumann W, Paul M, Tyson JJ. Exploring the roles of noise in the eukaryotic cell cycle. Proc Natl Acad Sci USA 2009 - PMC - PubMed
    1. Ball DA, Ahn T-H, Wang P, Chen KC, Cao Y, et al. Stochastic exit from mitosis in budding yeast: model predictions and experimental observations. Cell Cycle. 2011;10:999–1009. - PMC - PubMed
    1. Chen KC, Calzone L, Csikasz-Nagy A, Cross FR, Novak B, et al. Integrative analysis of cell cycle control in budding yeast. Molecular Biology of the Cell. 2004;15:3841–3862. - PMC - PubMed

Publication types