. 2011;6(10):e26512.
doi: 10.1371/journal.pone.0026512. Epub 2011 Oct 27.

Overexpression of active Aurora-C kinase results in cell transformation and tumour formation

Affiliations

Overexpression of active Aurora-C kinase results in cell transformation and tumour formation

Jabbar Khan et al. PLoS One. 2011.

Abstract

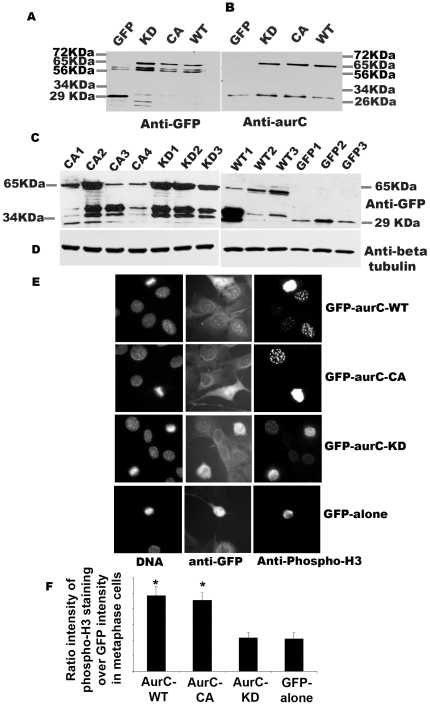
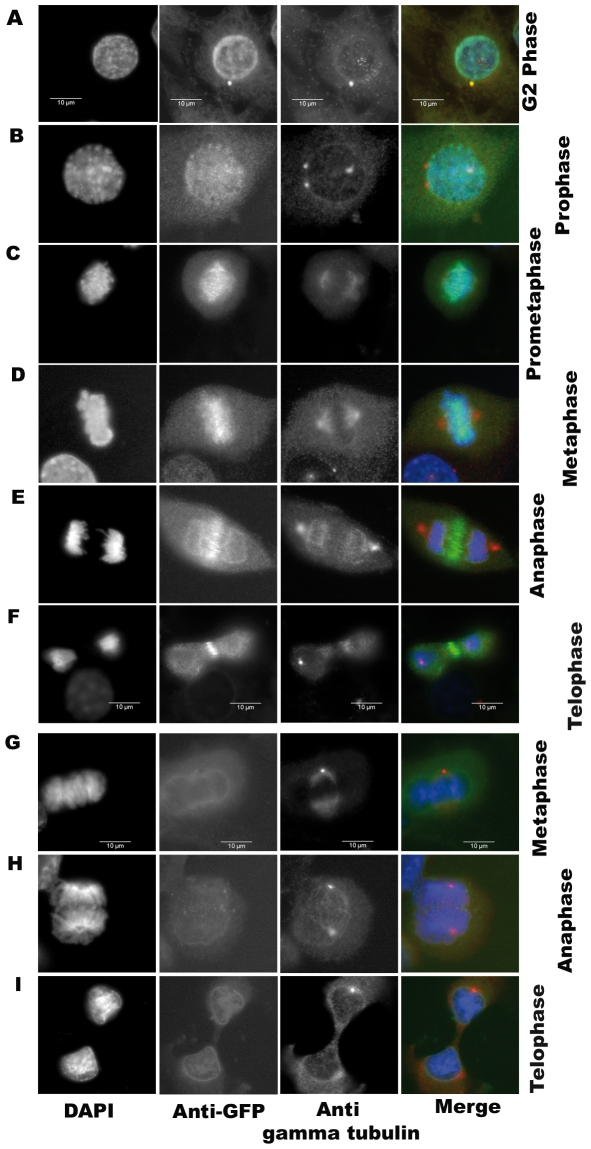
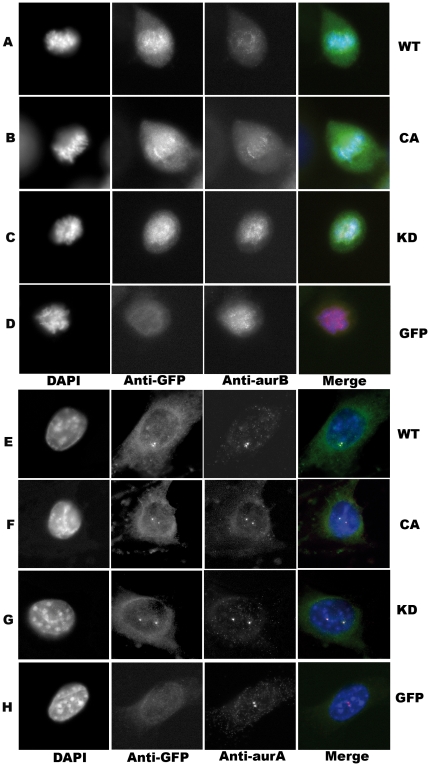
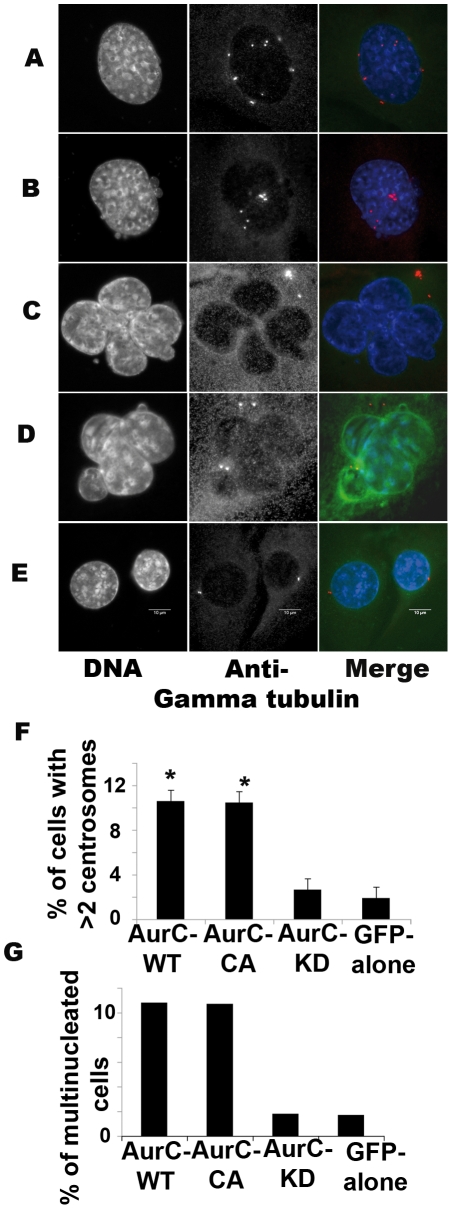
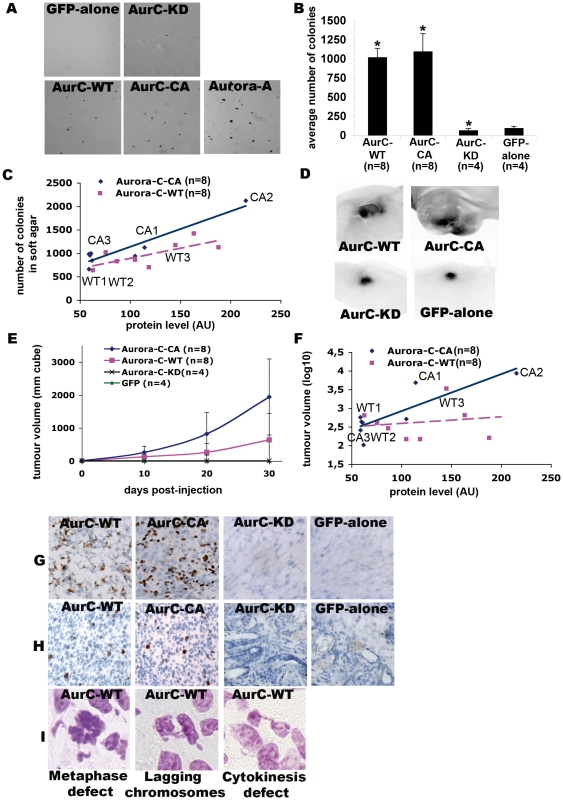
Aurora kinases belong to a conserved family of serine/threonine kinases key regulators of cell cycle progression. Aurora-A and Aurora-B are expressed in somatic cells and involved mainly in mitosis while Aurora-C is expressed during spermatogenesis and oogenesis and is involved in meiosis. Aurora-C is hardly detectable in normal somatic cells. However all three kinases are overexpressed in many cancer lines. Aurora-A possesses an oncogenic activity while Aurora-B does not. Here we investigated whether Aurora-C possesses such an oncogenic activity. We report that overexpression of Aurora-C induces abnormal cell division resulting in centrosome amplification and multinucleation in both transiently transfected cells and in stable cell lines. Only stable NIH3T3 cell clones overexpressing active Aurora-C formed foci of colonies when grown on soft agar, indicating that a gain of Aurora-C activity is sufficient to transform cells. Furthermore, we reported that NIH-3T3 stable cell lines overexpressing Aurora-C induced tumour formation when injected into nude mice, demonstrating the oncogenic activity of enzymatically active Aurora kinase C. Interestingly enough tumor aggressiveness was positively correlated with the quantity of active kinase, making Aurora-C a potential anti-cancer therapeutic target.


Conflict of interest statement

Competing Interests: The authors have declared that no competing interests exist.

Figures

Figure 1
Figure 1. Expression and activity of GFP-Aurora-C in transiently transfected cells and in stable cell lines.
(A–B) NIH-3T3 cells were transfected with GFP-aurC-WT (Aurora-C-wild type), GFP-aurC-CA (Aurora-C-T191D, constitutively active), GFP-aurC-KD (Aurora-C-K72R, kinase dead) and GFP-alone plasmids. Proteins were extracted 24 hours after transfection and immunoprecipitated with mouse anti-GFP (A) and polyclonal rabbit anti-Aurora-C (B) antibodies. Western blots were revealed using (A) mouse Anti-GFP antibody and (B) polyclonal rabbit Anti-Aurora-C antibody and showed level of expression of GFP-aurC at about 65 kDa and GFP-alone at 29 kDa. (C–D) Western blots showed the level of expression of GFP-aurC protein in stable NIH-3T3 clones of GFP-aurC-KD (KD1 to KD3), GFP-aurC-CA (CA1 to CA4), GFP-aurC-WT (WT1 to WT3) and GFP-alone (GFP1 to GFP3) illustrating the different level of expression of GFP-aurC and GFP proteins by different clones. The antibodies were (C) mouse anti-GFP and (D) anti-β tubulin antibody for loading control. (E) Immunofluorescence was performed on stable cell clones overexpressing GFP-aurC-WT, GFP-aurC-CA, GFP-aurC-KD and GFP-alone plasmids. Cells were stained with rabbit anti-phospho histone H3 ser-10 then anti-rabbit Alexa-555 and DAPI. The left column shows DAPI stained cells and the right column shows phosphorylated Histone-H3 ser-10 cells. (F) Histogram shows the ratio of H3-staining intensity (arbitrary unit from ImageJ) over GFP intensity in metaphase cells. A minimum of 300 cells were counted for each condition. We performed non-parametric Mann-Whitney test. Results were considered as statistically significant (*) for a p-value under 0.05 when compared to GFP-alone(*) condition.
Figure 2
Figure 2. Subcellular localization of GFP-Aurora C along cell cycle.
Immunofluorescence was performed on stable cell clones overexpressing GFP-aurC-WT, GFP-aurC-CA, GFP-aurC-KD and GFP-alone plasmids. Cells were stained with DAPI, anti-GFP and anti-gamma-tubulin antibodies. The immunoflorescent microscopy images show the localization of (A-F) GFP-aurC-WT and (G-I) GFP-alone. Localization of GFP-aurC-WT at (A) centrosome in G2 phase, (B) chromosomes/centromeres in prophase, (C) chromosomes in prometaphase, (D) chromosomes in metaphase, (E) the midzone of spindles in anaphase, (F) midbody in telophase. (G-I) Localization of GFP-alone in (G) metaphase, (H) anaphase, and (I) telophase. The original magnification used was 63×.
Figure 3
Figure 3. Localization of endogenous Aurora-A and Aurora-B in cell line overexpressing GFP-aurC.
Immunofluorescence was performed on stable cell clones overexpressing GFP-aurC-WT, GFP-aurC-CA, GFP-aurC-KD and GFP-alone plasmids. Cells were stained with DAPI, anti-GFP, and anti-Aurora-B antibodies (A-D) or anti-Aurora-A antibodies (E-H). The immunoflorescent microscopy images show also the localization of (A, E) GFP-aurC-WT, (B, F) GFP-aurC-CA, (C, G) GFP-aurC-KD and (D, H) GFP-alone during metaphase (A-D) or interphase (E-F). The original magnification used was 63×.
Figure 4
Figure 4. Centrosome number and multinucleation.
NIH-3T3 cells were transfected with (A, C) GFP-aurC-WT, (B, D) GFP-aurC-CA and (E) GFP-aurC-KD vectors, fixed after 96 hours and stained with DAPI and Anti-γ tubulin antibody. (A-B) More than two centrosomes/cell appeared as white dots with anti-γ tubulin staining in (A) GFP-aurC-WT and (B) GFP-aurC-CA transfected cells. (C-D) Multinucleation (more than one nucleus/cell) in (C) GFP-aurC-WT and (D) GFP-aurC-CA in transfected cells. (E) Two centrosomes per cell and only one nucleus/cell in G2 phase of GFP-aurC-KD transfected cells. (F) Histogram shows the percentage of cells with more than 2 centrosomes/cell of 96 hours GFP-aurC-WT, GFP-aurC-CA, GFP-aurC-KD and GFP-alone transfected cells. (G) Histogram shows the percentages of multinucleated cells of 96 hours GFP-aurC-WT, GFP-aurC-CA, GFP-aurC-KD and GFP-alone transfected cells. A minimum of 600 cells was counted for each condition. We performed non-parametric Mann-Whitney test. Results were considered as statistically significant (*) for a p-value under 0.05 when compared to GFP-alone condition.
Figure 5
Figure 5. Cell growth in soft agar and tumour formation correlated with the quantity of active Aurora-C.
(A-C) Stable cell clones of GFP-aurC-WT (n = 9), GFP-aurC-CA (n = 9), GFP-aurC-KD (n = 4), GFP-alone (n = 4) and GFP-AurA (n = 2) were tested in a soft agar growth assay. (A) Foci of colonies of GFP-aurC-WT, GFP-aurC-CA and GFP-aurA stable cell lines and very negligible number of very small colonies of GFP-aurC-KD and GFP-alone cell lines. (B) Histogram of the average number of colonies. We performed non-parametric Mann-Whitney test. Results were considered as statistically significant (*) for a p-value under 0.05 when compared to GFP-alone condition. (C) The dot blot shows a positive correlation between protein expression level of GFP-aurC-WT and GFP-aurC-CA, quantified for each clone on immunoblot by ImageJ, and the number of colonies in soft agar. Full line and dotted line are linear regression for GFP-AurC-CA and GFP-AurC-WT respectively. The label of the cell lines are named after in Figure 1C. (D–I) Female immunocompromized mice (SWISS, nu/nu) were injected subcutaneously in the abdomen. We injected GFP-aurC-WT (n = 8 clones), GFP-aurC-CA (n = 8), GFP-aurC-KD (n = 4), and GFP-alone (n = 4) cell lines. (D) Visualization of the tumours formed by injecting GFP-aurC-WT and GFP-aurC-CA stable cell lines, and the remaining injected cells of GFP-aurC-KD and GFP-alone on the day of sacrifice. For these images, the cell line injected were WT3, CA2, KD2 and GFP2 cell lines as named in Figure 1C. (E) The graph indicates an appearance and a gradual increase of tumour volume with GFP-aurC-WT and GFP-aurC-CA cell lines and no tumour formation in GFP-aurC-KD and GFP-alone cell lines. (F) The dot blot shows a positive correlation between expression level of GFP-aurC-WT and GFP-aurC-CA, quantified for each clone on immunoblot by ImageJ, and the tumour volume at day 30. Full line and dotted line are linear regression for GFP-AurC-CA and GFP-AurC-WT respectively. (G–I) Immunohistochemistry was performed on frozen sections of tumours or remaining injected cells with (G) rabbit monoclonal KI-67, a proliferation marker from late G1 to M-phase and (H) anti-phospho histone-H3 ser-10 and anti-HRP secondary antibodies, and (I) Feulgen staining.

References

    1. Nigg EA. Mitotic kinases as regulators of cell division and its checkpoints. Nat Rev Mol Cell Biol. 2001;2:21–32. - PubMed
    1. Tatsuka M, Katayama H, Ota T, Tanaka T, Odashima S, et al. Multinuclearity and increased ploidy caused by overexpression of the Aurora- and Ipl1-like midbody-associated protein mitotic kinase in human cancer cells. Cancer Res. 1998;58:4811–4816. - PubMed
    1. Kimura M, Matsuda Y, Yoshioka T, Okano Y. Cell cycle-dependent expression and centrosome localization of a third human Aurora/Ipl1-related protein kinase, AIK3. J Biol Chem. 1999;274:7334–7340. - PubMed
    1. Lin YS, Su LJ, Yu CT, Wong FH, Yeh HH, et al. Gene expression profiles of the Aurora family kinases. Gene Expr. 2006;13:15–26. - PMC - PubMed
    1. Sasai K, Katayama H, Stenoien DL, Fuji S, Honda R, et al. Aurora-C kinase is a novel chromosomal passenger protein that can complement Aurora-B kinase function in mitotic cells. Cell Motil Cytoskeleton. 2004;59:249–263. - PubMed

Publication types