Review
. 2011 Dec;21(12):682-91.
doi: 10.1016/j.tcb.2011.09.008. Epub 2011 Oct 31.

Microscopy in 3D: a biologist's toolbox

Affiliations
Review

Microscopy in 3D: a biologist's toolbox

Robert S Fischer et al. Trends Cell Biol. 2011 Dec.

Abstract

The power of fluorescence microscopy to study cellular structures and macromolecular complexes spans a wide range of size scales, from studies of cell behavior and function in physiological 3D environments to understanding the molecular architecture of organelles. At each length scale, the challenge in 3D imaging is to extract the most spatial and temporal resolution possible while limiting photodamage/bleaching to living cells. Several advances in 3D fluorescence microscopy now offer higher resolution, improved speed, and reduced photobleaching relative to traditional point-scanning microscopy methods. We discuss a few specific microscopy modalities that we believe will be particularly advantageous in imaging cells and subcellular structures in physiologically relevant 3D environments.


Figures

Figure 1
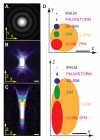
Figure 1. The effect of diffraction on imaging in 3D
(A) An idealized diffraction pattern of a point source observed in a microscope. The inner spot is the so-called Airy disk. (B) A slice in the XZ plane from a three dimensional image stack of a fluorescent collected in an aqueous medium, centered at 5 μm from the coverslip. Note side flanges on the distribution are symmetric in X and in Z. (C) A similar XZ-plane to that shown in (B), but taken from a three dimensional image stack of a fluorescent bead collected in a collagen gel at 150 μm from the coverslip. Note elongated distribution and asymmetry in the Z axis. (D) Effective PSFs of various microscopy methods, in lateral dimensions (X-Y, top) and axial dimensions (X-Z, bottom). The observed PSF of each is drawn to scale, scale bar = 0.25 μm. For super-resolution techniques, practical ‘resolution volumes’ are shown instead, since these techniques are not limited by the diffraction-limited PSF of the microscope system.
Figure 2
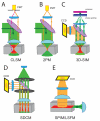
Figure 2. Optical paths of 3D microscopy modes
In all panels, illumination light is green, dichromatic mirror is purple, specimen is gray, sample excitation is red, in-focus fluorescence emission is orange, lenses are blue, detector is yellow. (A) Confocal laser scanning microscopy light path. Excitation laser light is focused through the objective lens to a diffraction-limited spot in the focal plane of the sample. Note that fluorescence is excited above and below the focal plane. Out-of-focus fluorescence (pink) is rejected by the pinhole, while in-focus light is allowed through the pinhole (black) and collected by the photomultiplier (PMT). (B) Two-photon microscopy light path. Infrared pulsed-laser illumination is focused to a diffraction-limited volume such that two-photon excitation is confined to this small volume (red). Since all fluorescence that is created by this excitation originates in the focal plane, no pinhole is needed, and all fluorescence captured by the objective lens is focused to the point source detector (PMT). (C) Structured illumination microscopy. Laser illumination is collimated onto a phase grating, creating three alternate phases that are recombined through the objective lens into the sample where they interfere to create 3D patterned illumination. Because excitation over all collected phases is essentially equivalent to wide-field excitation the entire axial volume is excited. Resulting fluorescence from each phase collection is reflected by the dichroic mirror and detected by a CCD (D) Spinning disk confocal microscopy light path. Laser excitation light passes through dual pinhole-array disks (black) that scan the excitation across the specimen by spinning at high speed. The fluorescence from points in the focal plane pass through the proximal disc pinholes, and are reflected by a dichroic mirror to an array detector such as a charge-coupled device (CCD) camera. For clarity, only four pinhole paths are shown. The sum of all scanning pinhole illumination over time excites the full axial volume of the sample. (E) Light-sheet fluorescence microscopy light path. Excitation light is focused into a sheet that is delivered to the specimen orthogonally to the axis of imaging. Thus, only the plane of focus is excited. Since all fluorescence is from the focal plane, no pinhole is needed, and the field of fluorescence is collected by an array detector, such as a CCD camera.
Figure 3
Figure 3
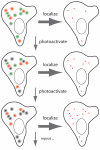
Photoactivated point source localization. In PALM and STORM, cells express proteins tagged with photoactivatible or photoconvertible fluorophores (green), random subsets of which are converted to fluoresce (red). Each of these single molecule point sources creates an Airy disk-like distribution of fluorescence at the detector, and the center of each such distribution is found computationally (red points in cell image on right). Since the molecules in the random subset are separated in space, overlap of the fluorescent emissions does not occur. Each fluorophore is imaged until it bleaches (grey), and then a new round of photoconversion and excitation occurs. As the cycles continue, point sources are imaged, localized, and bleached to build a dense localization map (bottom right).
Figure 4
Figure 4. 3D super-resolution microscopy approaches
(A) 3D-PALM/STORM. Small subsets of molecules are activated to fluoresce, isolated in space and time enough that they can be captured as distinct point sources. A weak cylindrical lens is inserted into the optical path (dark blue), which creates astigmatism such that point sources in the center focal plane (orange) appear laterally symmetric, while point sources at other Z-planes (pink) are distorted in either the X or Y direction (depending on depth), to appear elliptical on the CCD detector. Using known calibration curves of point sources enables Z-localization below the diffraction-limited resolution based on the shapes of the point sources observed in the image. (B) iPALM. Opposed high numerical aperture objective lenses are used to collect fluorescent light waves from photoactivated fluorescent point sources. Since a given fluorophore emits in all directions, both objectives capture the fluorescence, but the difference in the path traveled by each portion of the emitted fluorescence wave depend on the Z-plane of the original point source. The collected fluorescence is recombined with a a three-way beam splitter, which causes self-interference of each fluorescent photon. Such interference creates different intensities in the three output beams from the beam splitter, which vary according to the pathlength differences in the axial direction. Measurement of the relative intensities across the three detectors enables axial resolution better than 20 nm. (B) was reprinted with permission from .

References

    1. Waters JC. Accuracy and precision in quantitative fluorescence microscopy. J Cell Biol. 2009;185:1135–1148. - PMC - PubMed
    1. Cheong W, et al. A review of the optical properties of biological tissues. IEEE J. Quantum Electron. 1990;26:2166–2185.
    1. Ntziachristos V. Going deeper than microscopy: the optical imaging frontier in biology. Nat Methods. 2010;7:603–614. - PubMed
    1. Conchello JA, Lichtman JW. Optical sectioning microscopy. Nat Methods. 2005;2:920–931. - PubMed
    1. Egner A, et al. Refractive index mismatch induced intensity and phase variations in fluorescence confocal, multiphoton and 4Pi-microscopy. Optics Communications. 1998;153:211–217.