. 2011 Nov 8;105 Suppl 1(Suppl 1):S5-10.
doi: 10.1038/bjc.2011.417.

New pathways of care for cancer survivors: adding the numbers

Affiliations

New pathways of care for cancer survivors: adding the numbers

J Maher et al. Br J Cancer. .

Abstract

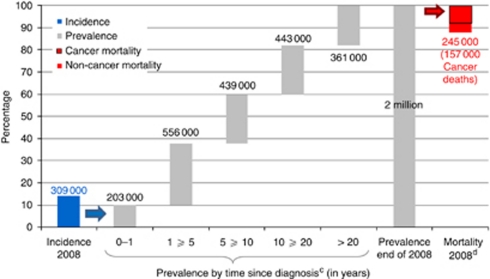
Background: Two million people in the UK had a cancer diagnosis at the end of 2008. Understanding the number of people diagnosed with cancer with and without health needs is valuable information that can be used to inform service planning, treatment provision and support for people at the right time in the right place as demand grows over time.

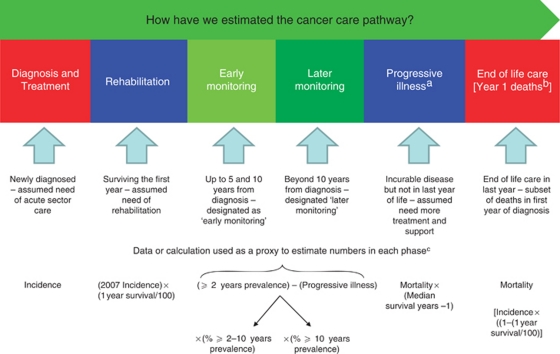
Methods: Using available data and clinically led assumptions about patient need and outcomes, we make indicative estimates. We quantify, for three common cancers, the number of people in each of the five main identified phases of the cancer care pathway.

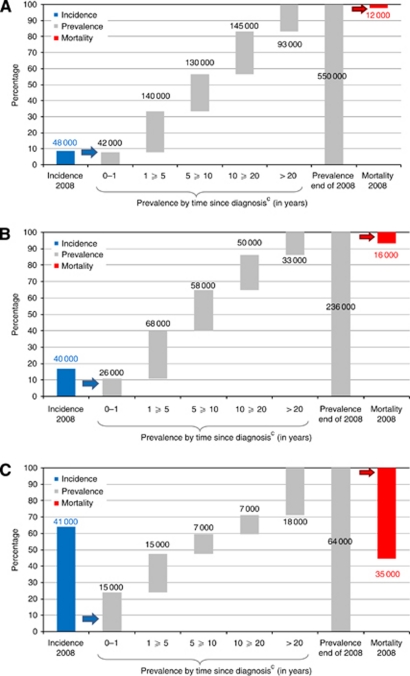
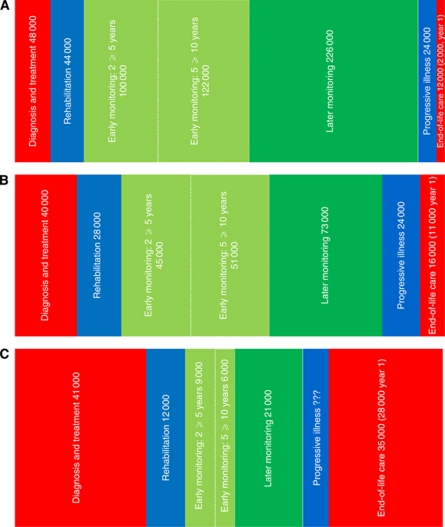
Results: Estimates are provided for each phase of the pathway for breast, colorectal and lung cancers. We estimate that there are nearly 575,000 women a year with breast cancer in the care pathway at some point in the year, 8% are in the rehabilitation phase and 4% in the progressive illness phase. This compares to nearly 270,000 with colorectal and around 95,000 with lung cancer.

Conclusion: Using readily available data, we estimate the numbers of patients with different health needs. These numbers could inform the targeting of resources for service providers.


Figures

Figure 1
Figure 1
People newly diagnosed, people living with cancer by year since diagnosis and deaths for people with a cancer diagnosis, UK, 2008.a,b aAll cancers exclude non-melanoma skin cancer (ICD-10 C44), except for cancer deaths that include deaths from all malignancies. bIncidence is the number of newly diagnosed cases and is a count of tumours in 2008. Mortality is a count of deaths due to cancer in 2008. Prevalence is a count of the number of people living with cancer at the end of 2008. cPrevalence measures time since diagnosis up to 1, 5, 10 or 20 years. For example, ‘1⩾5 years’ means more than 1 year and up to 5 years since diagnosis and ‘>20 years’ is more than 20 years since diagnosis. dThe number of deaths for people with a cancer diagnosis, 245 000, is estimated assuming that the rate of increase in prevalence is 3.2% (Maddams et al, 2009) and using incidence and mortality data. Prevalence is increasing at 3.2% a year; thus, approximately 64 000 people are added to the prevalent stock at the end of 2008. The increase in prevalence (64 000) is a product of new cases and deaths. With 309 000 new cases and 157 000 cancer deaths in 2008, we estimate that approximately 88 000 people die from other causes; therefore, we estimate that there were 245 000 deaths for people with a cancer diagnosis. Sources: Maddams et al (2009); Cancer Research UK (2010); Information Services Division (ISD) Scotland (2010); Northern Ireland Cancer Registry (2011); Welsh Cancer Intelligence and Surveillance Unit (2010); Office for National Statistics (2010a, 2010b).
Figure 2
Figure 2
Assumptions and calculations used to estimate the cancer care pathway. aThe numbers in the progressive illness group will be underestimated and the numbers in the monitoring groups overestimated as estimates for significant late effects have not been made. bWe calculate a subset of deaths in the first year of diagnosis to clarify the risk of double counting in diagnosis and treatment and end of life care. cUnless otherwise stated data are for 2008.
Figure 3
Figure 3
(A) Women newly diagnosed, living with breast cancer by year since diagnosis and breast cancer deaths, UK, 2008.a,b (B) People newly diagnosed, living with colorectal cancer by year since diagnosis and colorectal cancer deaths, UK, 2008.a,b (C) People newly diagnosed, living with lung cancer by year since diagnosis and lung cancer deaths, UK, 2008.a,b aFemale breast (ICD-10 C50). Colon, rectum and anus (ICD-10 C18-C21). Lung, bronchus and trachea (ICD-10 C33-C34). bIncidence is the number of newly diagnosed cases and is a count of tumours in 2008. Mortality is a count of deaths due to cancer in 2008. Prevalence is a count of the number of people living with cancer at the end of 2008. cPrevalence measures time since diagnosis up to 1, 5, 10 or 20 years. For example, ‘1⩾5 years’ means more than 1 year and up to 5 years since diagnosis and ‘>20 years’ is more than 20 years since diagnosis. The prevalence estimate for men with lung cancer more than 20 years from diagnosis is likely be overestimated by ∼8000. Sources: Maddams et al (2009); Cancer Research UK (2010); Information Services Division (ISD) Scotland (2010); Northern Ireland Cancer Registry (2011); Welsh Cancer Intelligence and Surveillance Unit (2010); Office for National Statistics (2010a, 2010b).
Figure 4
Figure 4
(A) Breast cancer care pathway: estimating the number of women in the UK, 2008*. (B) Colorectal cancer care pathway: estimating the number of people in the UK, 2008*. (C) Lung cancer care pathway: estimating the number of people in the UK, 2008*. *For each cancer type, the size of the boxes reflects the approximate proportion of people in each phase (however, there is double counting for people who are diagnosed and die in the same year – these numbers are indicated in brackets; i.e., ‘XX 000 year 1’). Median survival for incurable disease was taken from Frontier Economics (2010) and is 3 years for breast and 2.5 years for colorectal. Estimates for progressive illness for lung cancer have not been made. Estimates for later monitoring for lung cancer exclude 8000 men >20 years from diagnosis. The total for men in this group was thought to be an overestimate and is likely to be nearer 6000 than the modelled 14 000 (Maddams et al, 2009). Sources: Maddams et al (2009); Office for National Statistics (2009, , 2010b); Cancer Research UK (2010); Frontier Economics (2010); Information Services Division (ISD) Scotland (2010); Northern Ireland Cancer Registry (2011); Welsh Cancer Intelligence and Surveillance Unit (2010); Office for National Statistics and London School of Hygiene and Tropical Medicine (2011).

References

    1. Andreyev HJ, Wotherspoon A, Denham JW, Hauer-Jensen M (2011) ‘Pelvic radiation disease’: new understanding and new solutions for a new disease in the era of cancer survivorship. Scand J Gastroenterol 46(4): 389–397 - PubMed
    1. Armes J, Crowe M, Colbourne L, Morgan H, Murrells T, Oakley C, Palmer N, Ream E, Young A, Richardson A (2009) Patients’ supportive care needs beyond the end of cancer treatment: a prospective, longitudinal survey. J Clin Oncol 27(36): 6172–6179 - PubMed
    1. Cancer Research UK (2010) Cancer mortality – UK statistics. http://info.cancerresearchuk.org/prod_consump/groups/cr_common/@nre/@sta... (accessed April 2011)
    1. Department of Health, Macmillan Cancer Support and NHS Improvement (2010) The National Cancer Survivorship Initiative Vision
    1. Frontier Economics (2010) One to one support for cancer patients: a report prepared for Department of Health