. 2012 Feb;32(1):50-60.
doi: 10.1007/s10875-011-9602-y. Epub 2011 Nov 3.

TLR-mediated B cell defects and IFN-α in common variable immunodeficiency

Affiliations

TLR-mediated B cell defects and IFN-α in common variable immunodeficiency

Joyce E Yu et al. J Clin Immunol. 2012 Feb.

Abstract

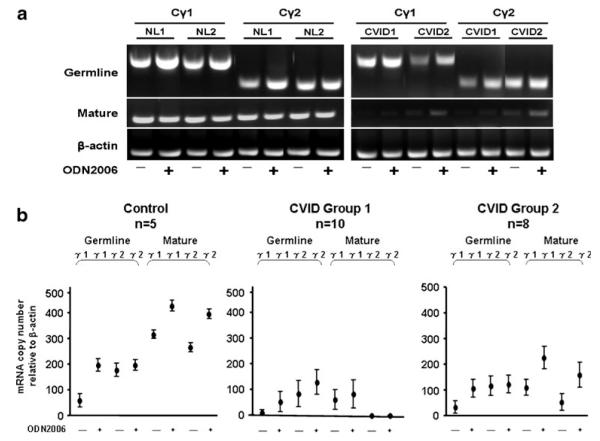
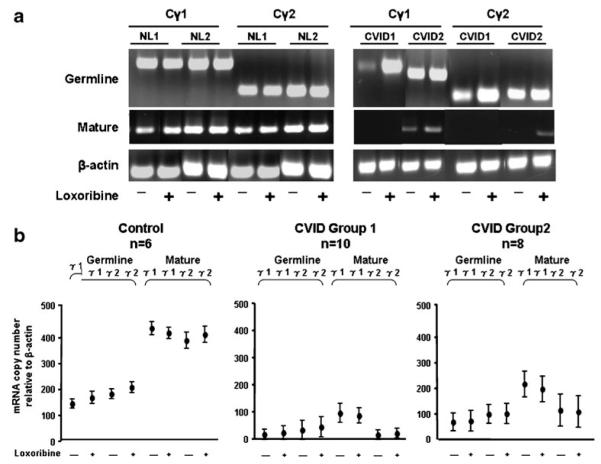
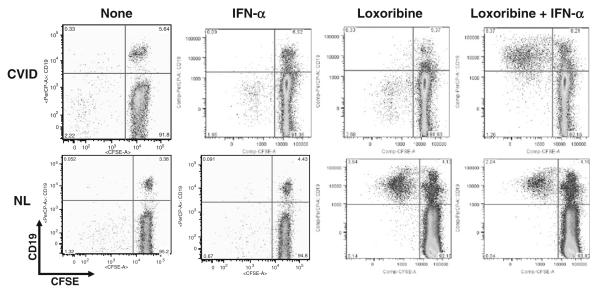
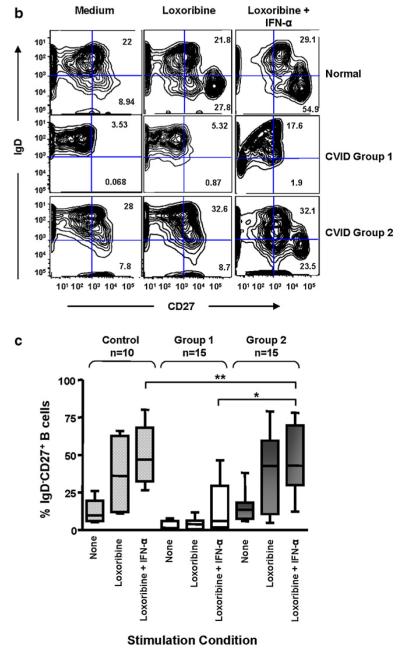
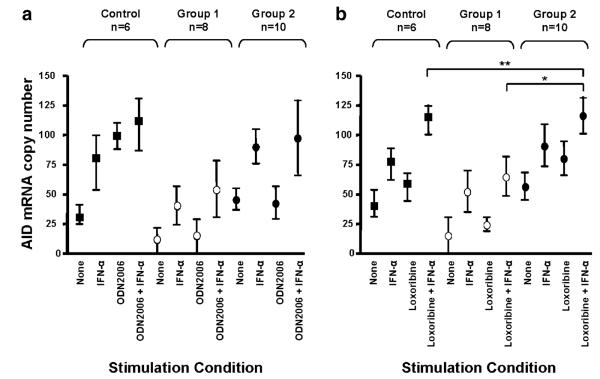
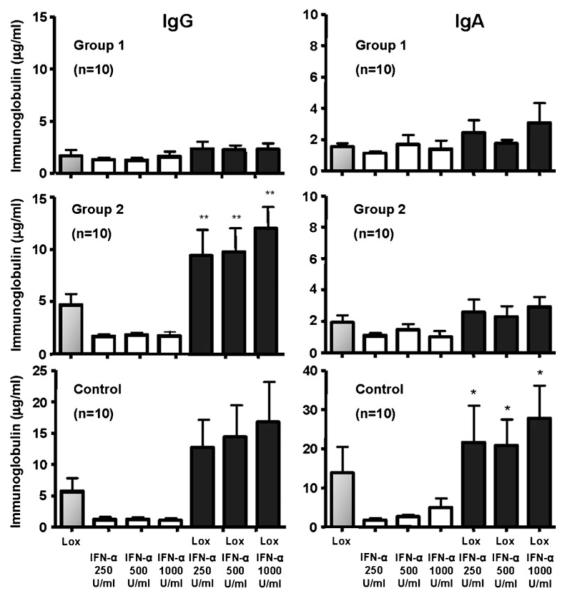
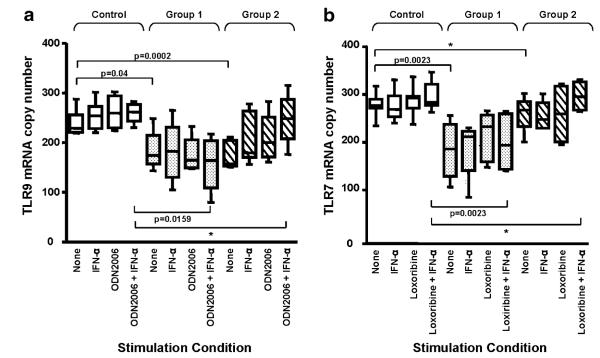
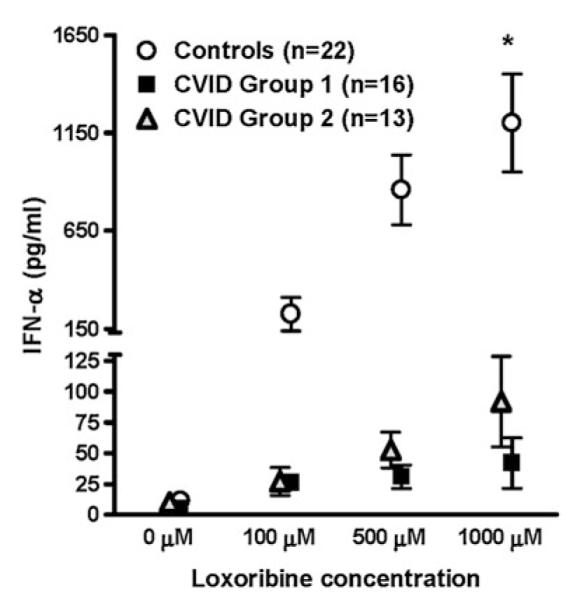
Common variable immune deficiency (CVID) B cells have impaired responses to TLR7 and TLR9 agonists including poor cell proliferation, loss of cytokine production, and failure to produce IgG or IgA. We show that TLR7- or 9-activated B cells from CVID subjects with >0.5% peripheral isotype-switched CD27(+) B cells (group 2) have increased mature Cγ1 and Cγ2 heavy-chain mRNA transcripts compared to subjects who have <0.5% isotype-switched cells (group 1). While TLR-stimulated CVID plasmacytoid dendritic cells for all subjects had impaired IFN-α production, TLR7 or TLR9 stimulation in the presence IFN-α normalized isotype-switched CD27(+) B cells, enhanced activation-induced cytidine deaminase mRNA, and significantly improved IgG production only for group 2 subjects. IFN-α also upregulated TLR7 and TLR9 mRNA expression comparable to normal levels in B cells of group 2 subjects, indicating that the loss of IFN-α could be a significant component of the B-cell defect for these subjects.


Figures

Fig. 1
Fig. 1
TLR9 activation of germline and mature heavychain transcripts. Isolated CD27+ B cells (1×10⁶ cells/ml) from a representative CVID group 1 (CVID 1), group 2 (CVID 2) subject, and two normal controls (NL) were cultured in medium (−) or with 0.6 μg/ml ODN2006 (+) for an optimal time (72 h) (a). Germline and mature Cγ1 and Cγ2 mRNA expression was assessed by RT-PCR. b Quantitative real time PCR results in CD27+ B cells from controls, ten CVID group 1, and eight CVID group 2 subjects in medium alone (−) or stimulated with 0.6 μg/ml ODN2006 (+). The data are expressed as copy number relative to β-actin and shown as the mean±standard error of the mean (SEM)
Fig. 2
Fig. 2
TLR7 activation of germline and mature heavy chain transcripts. Isolated CD27+ B cells (1×10⁶ cells/ml) from a representative CVID group 1 (CVID 1), group 2 (CVID 2) subject, and two normal controls (NL) were cultured in medium (−) or with 500 μM loxoribine (+) for 72 h (a). Germline and mature Cγ1 and Cγ2 mRNA expression was assessed by RT-PCR. b Realtime PCR results in CD27+ B cells from controls, ten CVID group 1, and eight CVID group 2 subjects in medium alone (−) or with 500 μM loxoribine (+). The data are expressed as mean copy number±SEM relative to β-actin
Fig. 3
Fig. 3
a TLR7 and IFN-α induce B cell proliferation and isotype switching. The effects of 1000 U/ml IFN-α, 500 μM loxoribine, or both IFN-α and loxoribine on B cell proliferation after 6 days of culture, are demonstrated for a CVID subject (top panel) and a control. CFSE dye dilution (x-axis) tracked cell division of CD19+ B cells (y-axis). b The number of CD27+IgD class-switched memory B cells in a control subject, were compared to B cells of a CVID Group 1 and 2 subject. Shown here, IFN-α in the presence of loxoribine increased the number of CD27+IgD cells for both the control and the group 2 subject but not for the group 1 subject. c Using a larger group of 10 controls, 15 group 1 subjects, and 15 group 2 subjects, the B cells of controls and CVID group 2 subjects again responded similarly to stimulation with loxoribine, particularly loxoribine with IFN-α, with significantly increased numbers of CD27+IgD class-switched memory B cells (**p=NS). Compared to Group 2 subjects, B cells of Group 1 subjects were significantly impaired (*p=0.008). The boxes and whiskers indicate mean and 25th and 75th percentiles
Fig. 3
Fig. 3
a TLR7 and IFN-α induce B cell proliferation and isotype switching. The effects of 1000 U/ml IFN-α, 500 μM loxoribine, or both IFN-α and loxoribine on B cell proliferation after 6 days of culture, are demonstrated for a CVID subject (top panel) and a control. CFSE dye dilution (x-axis) tracked cell division of CD19+ B cells (y-axis). b The number of CD27+IgD class-switched memory B cells in a control subject, were compared to B cells of a CVID Group 1 and 2 subject. Shown here, IFN-α in the presence of loxoribine increased the number of CD27+IgD cells for both the control and the group 2 subject but not for the group 1 subject. c Using a larger group of 10 controls, 15 group 1 subjects, and 15 group 2 subjects, the B cells of controls and CVID group 2 subjects again responded similarly to stimulation with loxoribine, particularly loxoribine with IFN-α, with significantly increased numbers of CD27+IgD class-switched memory B cells (**p=NS). Compared to Group 2 subjects, B cells of Group 1 subjects were significantly impaired (*p=0.008). The boxes and whiskers indicate mean and 25th and 75th percentiles
Fig. 4
Fig. 4
IFN-α augments TLR mediated AID mRNA expression. Isolated B cells from CVID group 1 and group 2 and control subjects were cultured with or without 0.6 μg/ml ODN2006 or 500 μM loxoribine for 72 h in the presence or absence of 1000 U/ml IFN-α. AID mRNA expression was assessed by quantitative real time PCR and expressed as mean copy number ± SEM relative to β-actin. Stimulation with IFN-α alone or either ODN2006 or loxoribine alone increased AID mRNA expression in all subjects, however, mRNA was most increased in B cells cultured with TLR agonist and IFN-α. For ODN-activated cultures, results for group 1 and 2 subjects were not statistically significant (Fig. 4a). However, in the presence of loxoribine, and especially IFN-α and loxoribine, AID mRNA was significantly upregulated for B cells of both controls and CVID group 2 subjects (**p=NS) but not for group 1 subjects (*p=0.005) (Fig. 4b)
Fig. 5
Fig. 5
IFN-α enhances TLR7-mediated IgG and IgA production. PBMCs from CVID group 1 subjects (n=10), CVID group 2 subjects (n=10), or control subjects (n=10) were stimulated with 500 μM loxoribine (Lox) in the presence of IFN-α (250, 500, or 1,000 U/ml) for 13 days. IgG and IgA levels were quantitated by ELISA. TLR7-mediated IgG secretion by control B cells and CVID group 2 subjects correlated with increasing concentrations of IFN-α above that produced in the presence of loxoribine alone (single asterisk, p=NS). In contrast, the addition of IFN-α did not reverse the poor response to loxoribine stimulation in CVID group 1 subjects. However, both CVID group 1 and 2 subjects produced significantly less, if any, IgA as compared to normal controls (two asterisks, p< 0.004) in the presence of both loxoribine and IFN-α. Data are expressed as mean±SEM
Fig. 6
Fig. 6
IFN-α promotes TLR7 and 9 mRNA expression in CD27+ B cells. Isolated CD27+ B cells from controls (n=10), CVID Group 1 (n=10), and CVID Group 2 (n=12) subjects were cultured with either 0.6 μg/ml ODN2006 or 500 μM loxoribine for 24 h with or without 1000 U/ml IFN-α. TLR7 and 9 mRNA expression was examined by quantitative real time PCR, expressed as copy number relative to β-actin. Boxes and whiskers represent mean and 25th and 75th percentiles. Baseline TLR9 expression in control B cells was significantly higher than CVID Group 1 (p=0.04) or Group 2 (p= 0.0002) B cells. While ODN2006 stimulation in the presence or absence of IFN-α did not affect TLR9 expression for CVID Group 1 B cells, IFN-α enhanced TLR9 mRNA expression levels in TLR9-stimulated CVID Group 2 B cells, comparable to control B cells (*p= NS) (Fig. 6a). CVID Group 1 B cells (p=0.0023), but not CVID Group 2 (Fig. 6b), had less TLR7 mRNA at baseline than control B cells. For B cells of Group 2, stimulation with loxoribine and IFN-α upregulated TLR7 expression to levels comparable to control B cells (*p=NS) but this did not occur for B cells of group 1 subjects
Fig. 7
Fig. 7
CVID group 1 and group 2 pDCs have similarly impaired IFN-α production. Isolated pDCs from CVID group 1 and group 2 subjects were stimulated with loxoribine for 48 h, and IFN-α levels in the supernatants were measured by ELISA. Normal pDCs served as controls. There was no difference in IFN-α production between CVID group 1 and group 2 subjects at 100 and 500 μM loxoribine although group 2 subjects produced more IFN-α than group 1 subjects at 1,000 μM (p=0.0454)

References

    1. Chapel H, Lucas M, Lee M, et al. Common variable immunodeficiency disorders: division into distinct clinical phenotypes. Blood. 2008;112:277–86. - PubMed
    1. Notarangelo LD, Fischer A, Geha RS, et al. Primary immunodeficiencies: 2009 update. J Allergy Clin Immunol. 2009;124:1161–78. - PMC - PubMed
    1. Brouet JC, Chedeville A, Fermand JP, Royer B. Study of the B cell memory compartment in common variable immunodeficiency. Eur J Immunol. 2000;30:2516–20. - PubMed
    1. Agematsu K, Futatani T, Hokibara S, et al. Absence of memory B cells in patients with common variable immunodeficiency. Clin Immunol. 2002;103:34–42. - PubMed
    1. Warnatz K, Denz A, Drager R, et al. Severe deficiency of switched memory B cells (CD27(+)IgM(−)IgD(−)) in subgroups of patients with common variable immunodeficiency: a new approach to classify a heterogeneous disease. Blood. 2002;99:1544–51. - PubMed

Publication types

MeSH terms