. 2011 Nov 2;3(107):107ra110.
doi: 10.1126/scitranslmed.3002573.

Lipotoxicity causes multisystem organ failure and exacerbates acute pancreatitis in obesity

Affiliations

Lipotoxicity causes multisystem organ failure and exacerbates acute pancreatitis in obesity

Sarah Navina et al. Sci Transl Med. .

Abstract

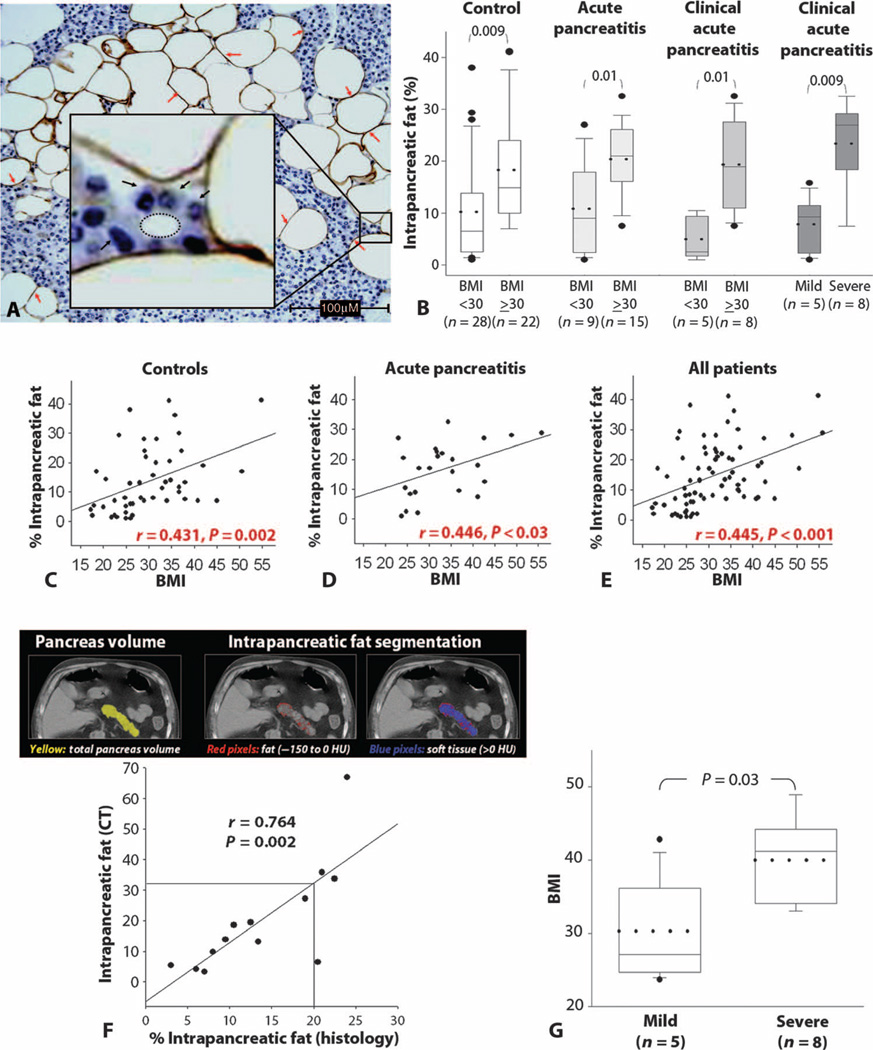
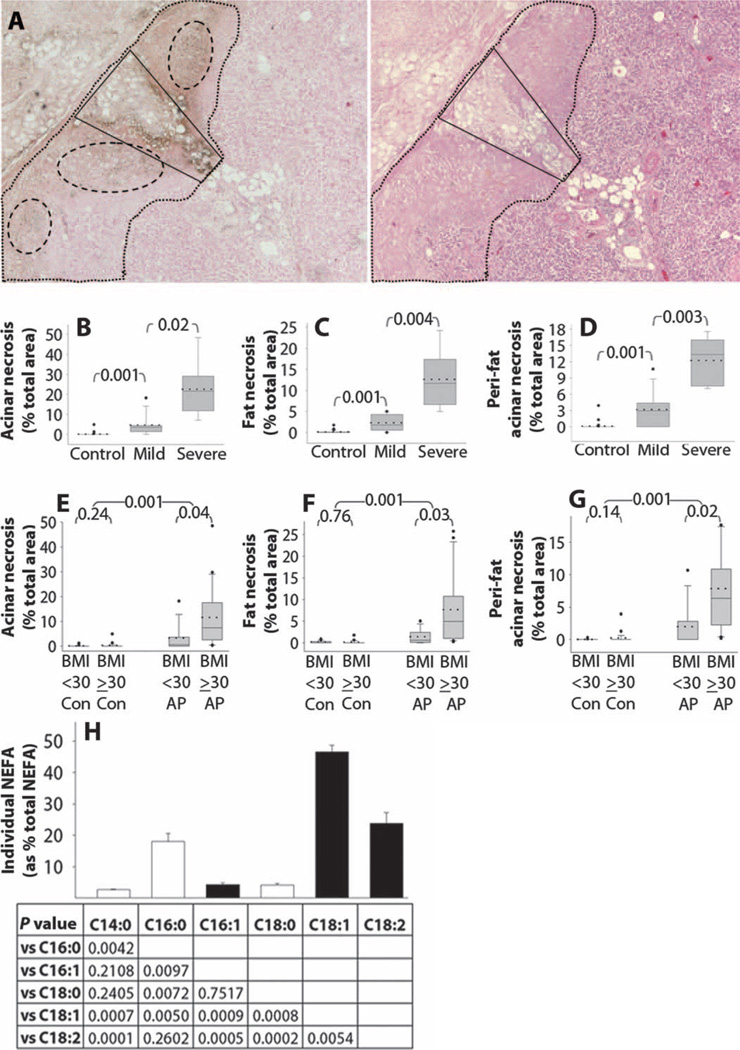
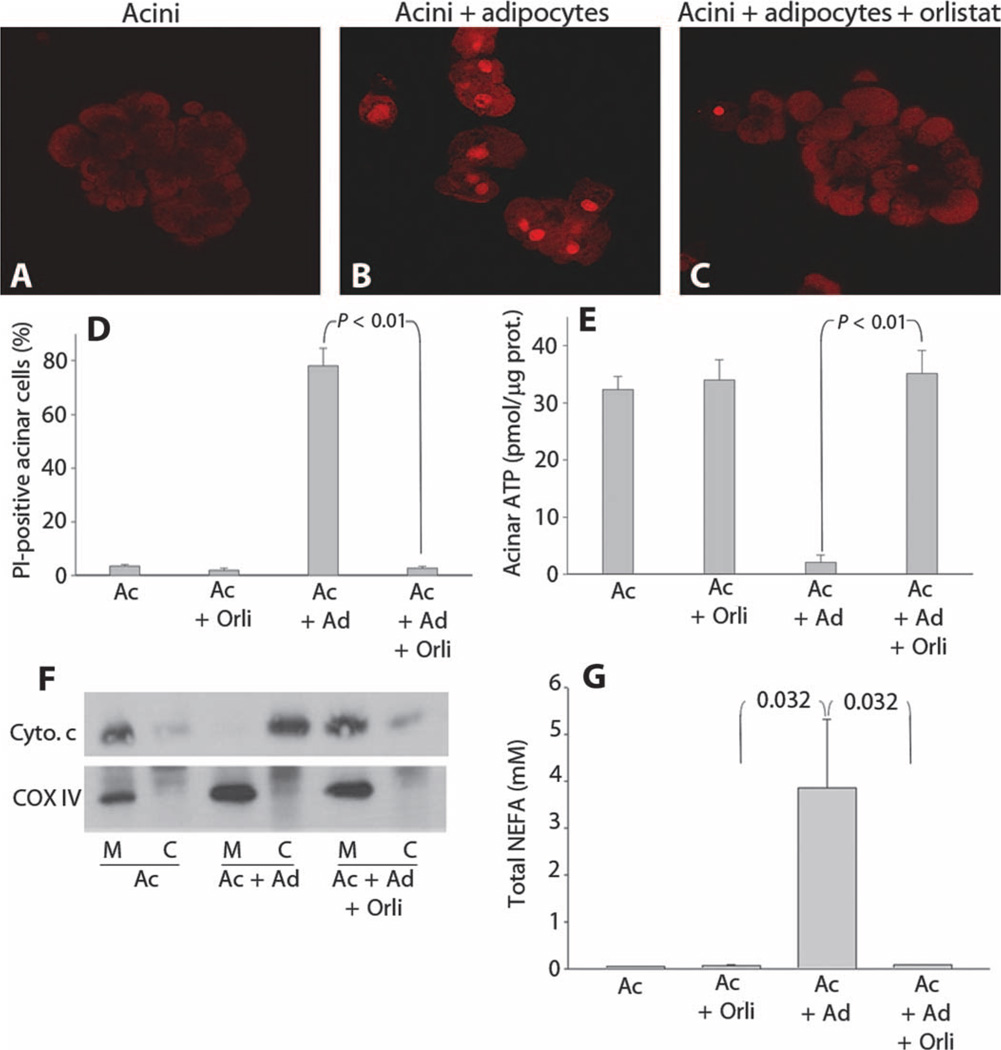
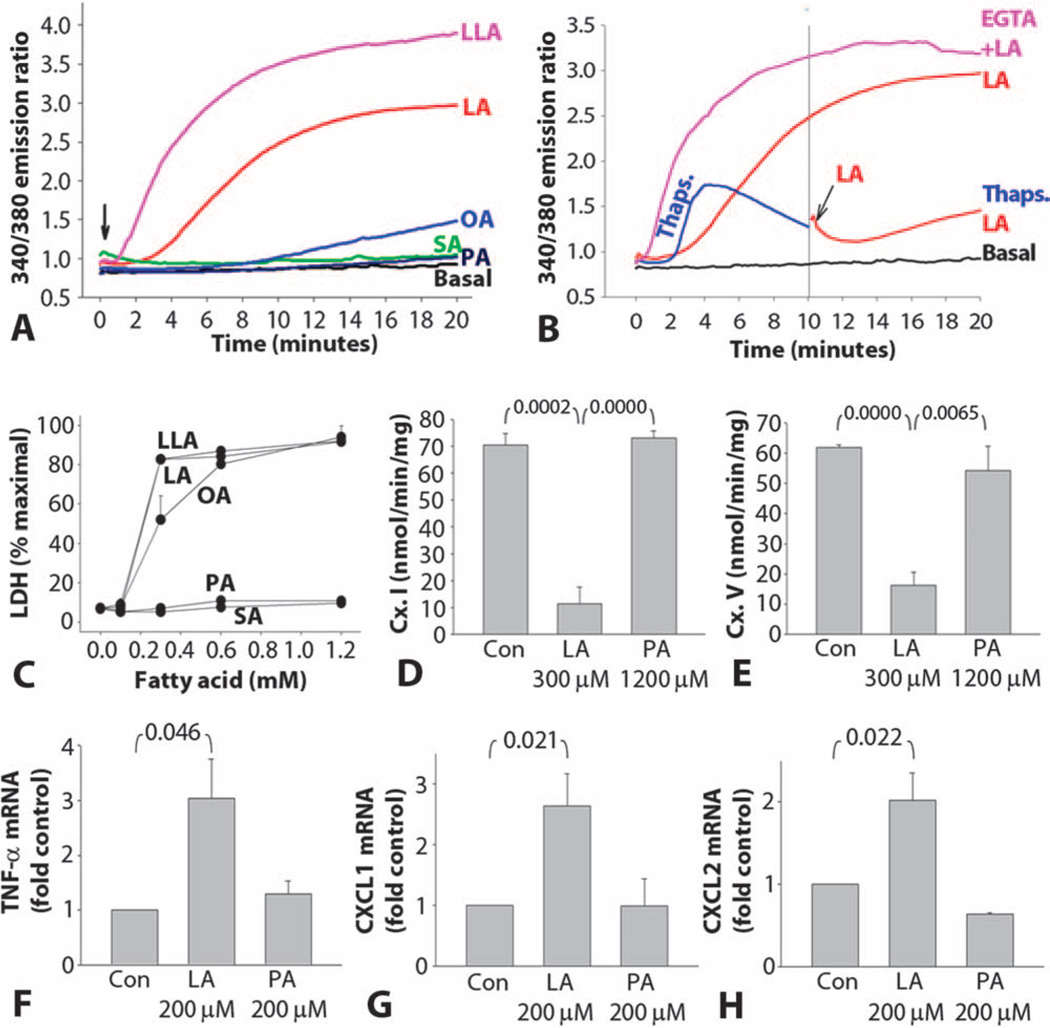
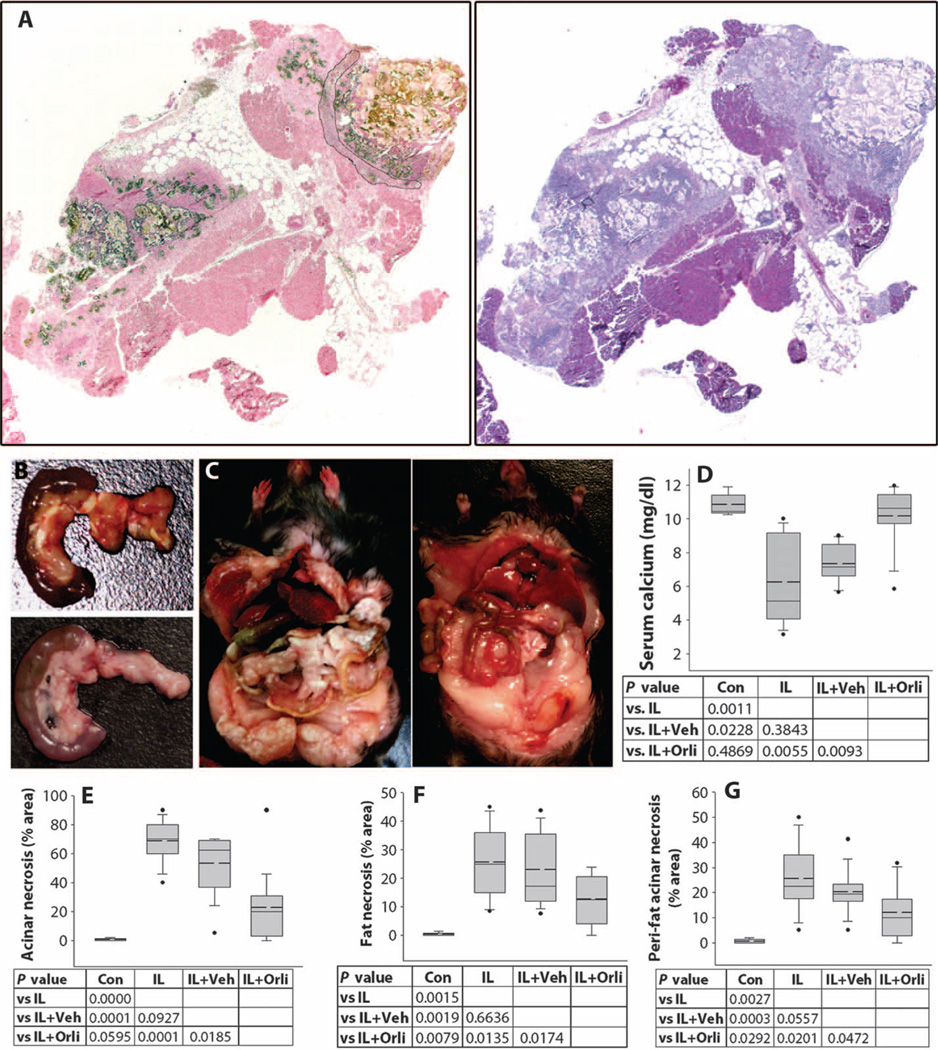
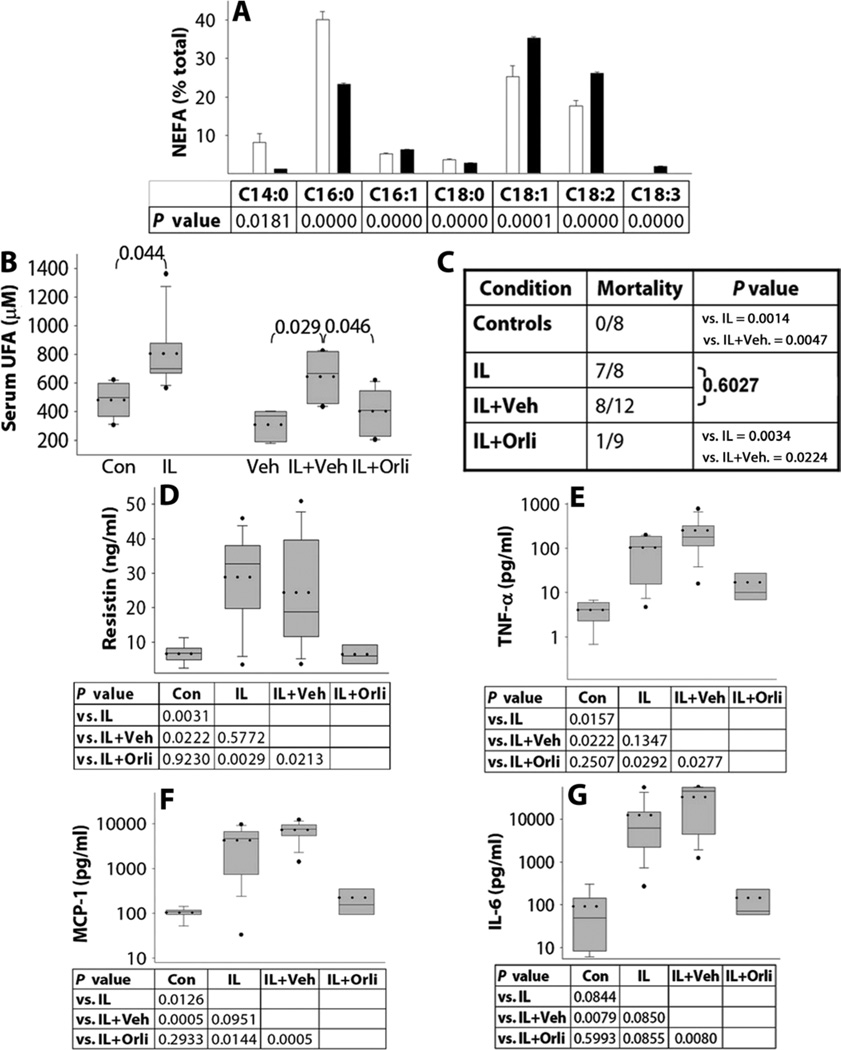
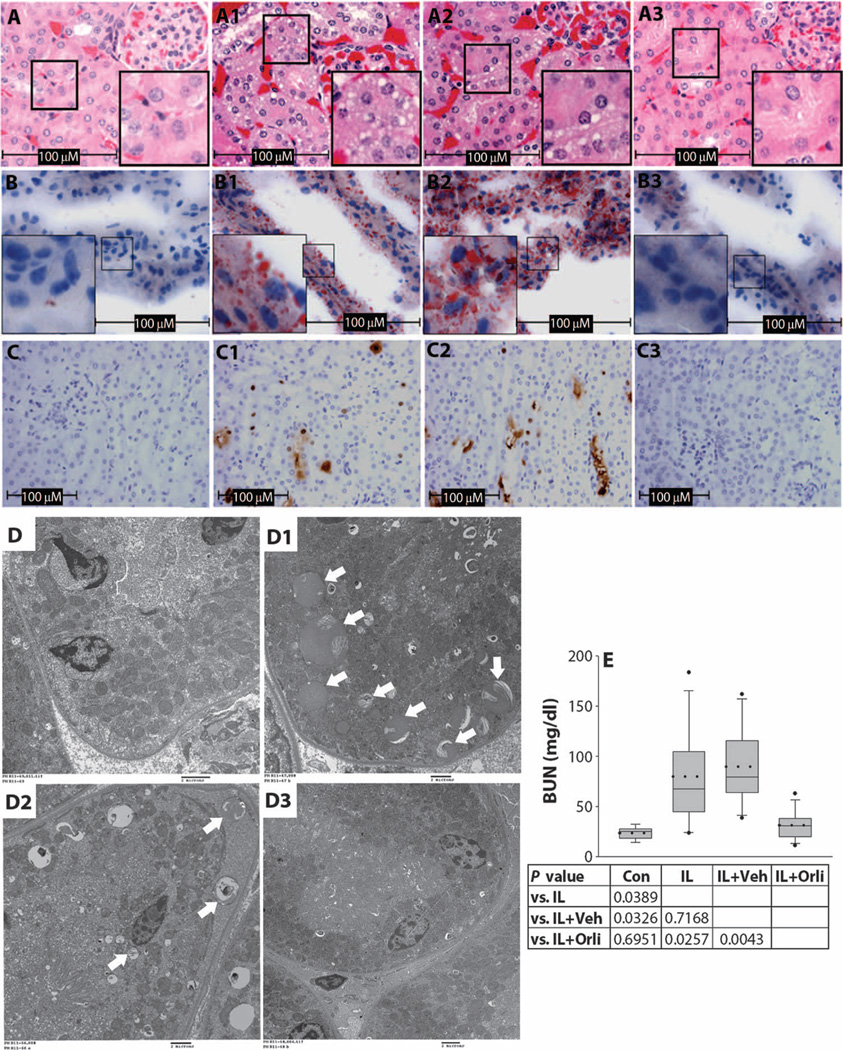
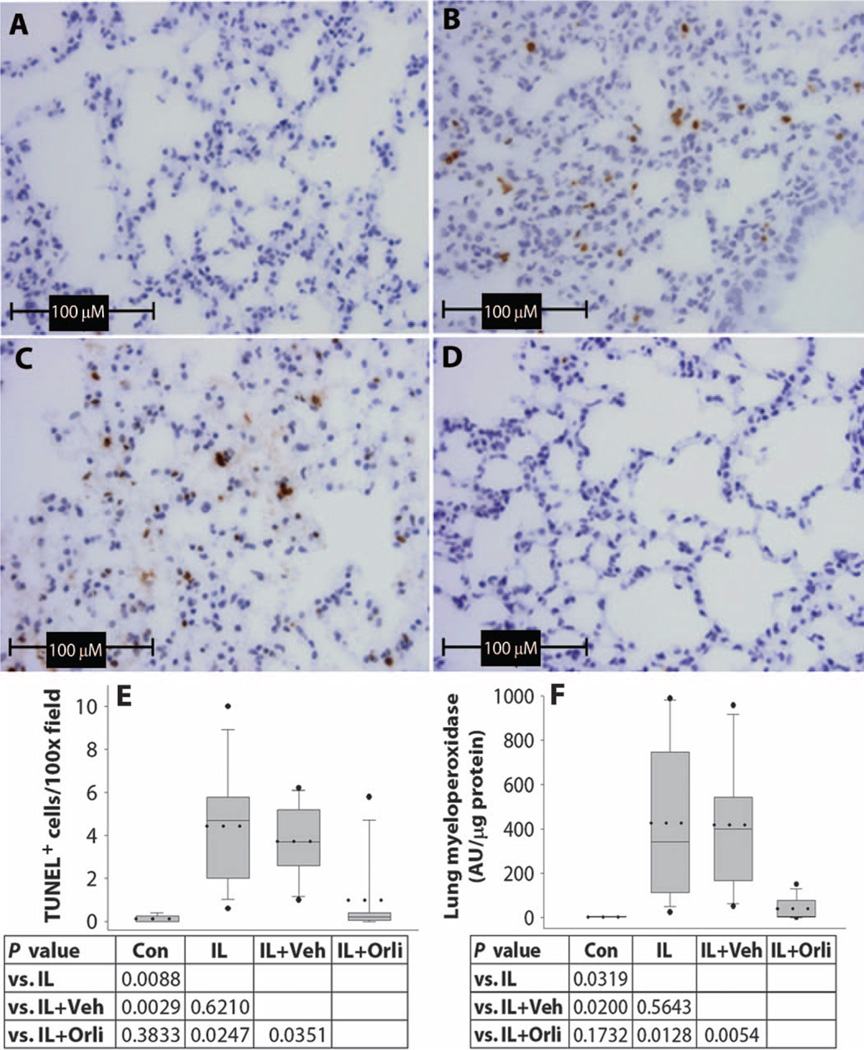
Obesity increases the risk of adverse outcomes during acute critical illnesses such as burns, severe trauma, and acute pancreatitis. Although individuals with more body fat and higher serum cytokines and lipase are more likely to experience problems, the roles that these characteristics play are not clear. We used severe acute pancreatitis as a representative disease to investigate the effects of obesity on local organ function and systemic processes. In obese humans, we found that an increase in the volume of intrapancreatic adipocytes was associated with more extensive pancreatic necrosis during acute pancreatitis and that acute pancreatitis was associated with multisystem organ failure in obese individuals. In vitro studies of pancreatic acinar cells showed that unsaturated fatty acids were proinflammatory, releasing intracellular calcium, inhibiting mitochondrial complexes I and V, and causing necrosis. Saturated fatty acids had no such effects. Inhibition of lipolysis in obese (ob/ob) mice with induced pancreatitis prevented a rise in serum unsaturated fatty acids and prevented renal injury, lung injury, systemic inflammation, hypocalcemia, reduced pancreatic necrosis, and mortality. Thus, therapeutic approaches that target unsaturated fatty acid-mediated lipotoxicity may reduce adverse outcomes in obese patients with critical illnesses such as severe acute pancreatitis.


Figures

Fig. 1
Fig. 1
Relationship between IPF and BMI. (A) Immunohistochemistry of human pancreatic section showing the staining of the adipocyte marker perilipin (stained brown, red arrows) in IPF. (Inset) Adipocytes normally abut the parenchymal basal surface (black arrows) and not the lumen (dashed oval), which carries exocrine pancreatic secretions. Scale bar, 100 µm. (B) IPF as a percentage of total area in controls (white), AP patients on autopsy (light gray), clinical AP patients with BMI of <30 or ≥30 (dark gray), and clinically mild AP and SAP patients. The dots within the bars indicate the mean, and the horizontal line within the bars indicates the median. P values are indicated for each pair. (C to E) Correlation between BMI and percentage IPF in controls (C), AP patients (D), and all patients (E). Each dot represents the value for an individual patient. (F) Correlation between IPF measured by noncontrast CT (thresholding method) and histology at autopsy [Hounsfield units (HU)]. (G) BMI of patients with mild and severe pancreatitis. The dots within the bars indicate the mean, and the horizontal line within the bars indicates the median.
Fig. 2
Fig. 2
Relationship between acinar necrosis, fat necrosis, and NEFAs. (A) Human pancreatitis serial sections stained for calcium with von Kossa (left) and hematoxylin and eosin (H&E) (right), showing fat necrosis (adipocytes in quadrangle staining dark brown on von Kossa and cheesy blue gray on H&E) and parenchymal injury (dotted lines) around calcium staining (dashed ovals). (B to D) Acinar necrosis (B), fat necrosis (C), and peri-fat acinar necrosis (D) box plots in controls (50 patients), clinically mild AP (8 patients), and SAP groups (5 patients). (E to G) Acinar necrosis (E), fat necrosis (F), and peri-fat acinar necrosis (G) in nonobese controls (BMI < 30 Con; n = 30), AP patients (BMI < 30 AP; n = 8), obese controls (BMI ≥ 30 Con; n = 20), and AP patients (BMI ≥ 30 AP; n = 16). The dots within the bars in (B) to (G) indicate the mean, and the horizontal line within the bars indicates the median. (H) NEFA composition in human pancreatic necrosis debridement fluid with individual NEFAs expressed as a percentage of total NEFA content. Each bar depicts the NEFA mentioned below the corresponding bar in the top row of the table. White bars, SFAs; black bars, UFAs. Numbers in the table below show P values between individual NEFAs mentioned in the rows and columns.
Fig. 3
Fig. 3
Lipolysis of adipocyte triglycerides causes acinar cell necrosis. (A to C) PI uptake in (A) control acini, cocultured with adipocytes (B) and adipocytes and 50 µM orlistat (C). (D) Percentage of acinar cells positive for PI uptake after culture alone (Ac), with 50 µM orlistat (Ac + Orli), adipocytes (Ac + Ad), or 50 µM orlistat (Ac + Ad + Orli). (E) ATP levels in acinar cells treated as in (D). (F) Cytochrome c (upper panel) in mitochondrial (M) and cytoplasmic (C) fractions of Ac, Ac + Ad, and Ac + Ad + Orli. (Lower panel) Mitochondrial marker COX IV. (G) Total NEFA concentrations in the medium of acini cells treated as in (D).
Fig. 4
Fig. 4
UFAs induce acinar necrosis and inflammatory mediator generation. (A) Intra-acinar calcium concentrations (expressed as 340/380 emission ratio) in response to addition (arrow) of 600 µM fatty acids (LLA, linolenic acid; LA, linoleic acid; OA, oleic acid; SA, stearic acid; PA, palmitic acid). (B) Effect of depletion of endoplasmic reticulum calcium with thapsigargin (1 µM) (blue line) and depletion of extracellular calcium by chelation with EGTA (1 mM added 10 min before adding linoleic acid, pink) on 600 µM linoleic acid–induced intracellular calcium increase. (C) Leakage of LDH from acinar cells 5 hours after treatment with fatty acids as in (A). (D and E) Effect of linoleic and palmitic acids on mitochondrial complex (Cx.) I and V activity in acini. (F) Effect of linoleic and palmitic acids on TNF-α RNA in acini. (G) Effect of linoleic and palmitic acids on CXCL1 mRNA in acini. (H) Effect of linoleic and palmitic acid CXCL2 mRNA. Data are expressed as means ± SEM.
Fig. 5
Fig. 5
Lipolysis exacerbates pancreatic damage in obese mice. (A) Von Kossa–stained (left) and H&E-stained (right) serial sections showing pancreatic fat necrosis (black and brown at left, lighter blue at right), surrounding parenchymal injury (pink at left, blue areas with loss of cellular detail at right). Dotted area, saponified parenchymal fat. (B) Gross images of the pancreas from vehicle-treated (top) or orlistat-treated (lower) animals with pancreatitis. White, areas of saponification. (C) Gross images of the peritoneal cavity from vehicle-treated (left) or orlistat-treated (right) animals with pancreatitis. White, areas of saponification. Note that orlistat prevents saponification. (D to G) Serum calcium (D), pancreatic necrosis (E), fat necrosis (F), and peri-fat acinar necrosis (G) (expressed as % of total area) were measured in control (Con), pancreatitis (IL), pancreatitis and vehicle-treated (IL + Veh), or pancreatitis and orlistat-treated (IL + Orli) animals. Dashed lines depict means. P values are shown in the table below.
Fig. 6
Fig. 6
Serum UFA, adipokines, cytokines, and mortality in obese mice are reduced by inhibiting lipolysis. (A) NEFAs in adipose tissue triglyceride of lean (white bars) and obese mice (black bars). P values between lean and obesemice are indicated beloweach NEFA. (B) SerumUFAs (µM) in controls animals (Con) and animals with pancreatitis (IL), vehicle (Veh), pancreatitis with vehicle (IL + Veh), and orlistat treatment (IL + Orli). (C) Seven-day mortality in ob/ob mice treated as in (B). (D to G) Serum adipokines and cytokines. Dotted lines depict means. P values are shown below.
Fig. 7
Fig. 7
Renal tubular lipotoxicity and renal failure are reduced by inhibiting lipolysis. (A to C) Mouse kidney sections stained with (A) H&E, (B) oil red O, and (C) TUNEL (terminal deoxynucleotidyl transferase–mediated deoxyuridine triphosphate nick end labeling) stain in control (A to C), pancreatitis (A1, B1, and C1), pancreatitis with vehicle (A2, B2, and C2), and pancreatitis with orlistat treatment (A3, B3, and C3) groups. (D) Electron microscopy of renal tubules from control mice (D), mice with pancreatitis (D1), mice with pancreatitis + vehicle (D2), and mice with pancreatitis + orlistat (D3) showing lipid vacuoles, some of which have dense deposits of calcification (arrows) and mitochondrial swelling. Scale bar, 2 µm. (E) Serum BUN in controls animals (Con) and animals with pancreatitis (IL), pancreatitis with vehicle (IL + Veh), and orlistat treatment (IL + Orli). Dotted lines depict means, and the whiskers indicate the 5th and 95th percentile, with the dots above and below plots indicating values outside this range. P values are shown below.
Fig. 8
Fig. 8
Lung injury and inflammation are reduced by inhibiting lipolysis. (A to D) Lung sections with TUNEL staining in control (A), pancreatitis (B), pancreatitis with vehicle (C), and pancreatitis with orlistat treatment (D) groups showing apoptotic cells. (E) Number of apoptotic cells in lung sections. (F) Lung myeloperoxidase in control animals (Con) and animals with pancreatitis (IL), pancreatitis with vehicle (IL + Veh), and orlistat treatment (IL + Orli). Dotted lines depict means. The whiskers indicate the 5th and 95th percentile, with the dots above and below plots indicating values outside this range. P values are shown below.

Comment in

References

    1. Ghanem AM, Sen S, Philp B, Dziewulski P, Shelley OP. Body mass index (BMI) and mortality in patients with severe burns: Is there a “tilt point” at which obesity influences outcome? Burns. 2011;37:208–214. - PubMed
    1. Neville AL, Brown CV, Weng J, Demetriades D, Velmahos GC. Obesity is an independent risk factor of mortality in severely injured blunt trauma patients. Arch. Surg. 2004;139:983–987. - PubMed
    1. Ciesla DJ, Moore EE, Johnson JL, Burch JM, Cothren CC, Sauaia A. Obesity increases risk of organ failure after severe trauma. J. Am. Coll. Surg. 2006;203:539–545. - PubMed
    1. Oliveros H, Villamor E. Obesity and mortality in critically ill adults: A systematic review and meta-analysis. Obesity. 2008;16:515–521. - PubMed
    1. Papachristou GI, Papachristou DJ, Avula H, Slivka A, Whitcomb DC. Obesity increases the severity of acute pancreatitis: Performance of APACHE-O score and correlation with the inflammatory response. Pancreatology. 2006;6:279–285. - PubMed

Publication types

MeSH terms