

Mechanically adaptive intracortical implants improve the proximity of neuronal cell bodies
- PMID: 22049097
- PMCID: PMC3386315
- DOI: 10.1088/1741-2560/8/6/066011
Mechanically adaptive intracortical implants improve the proximity of neuronal cell bodies
Abstract
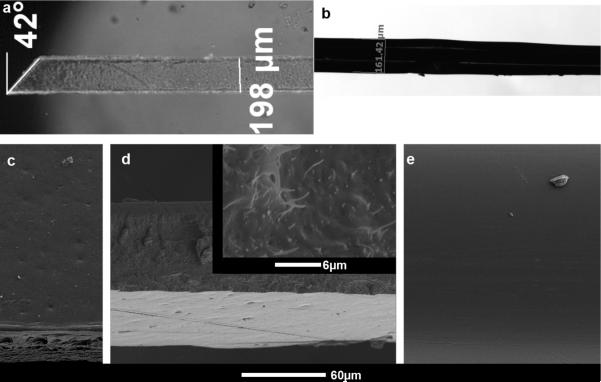
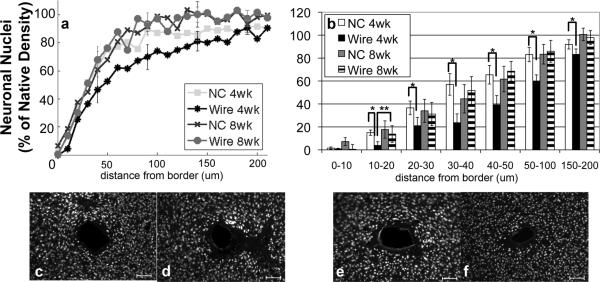
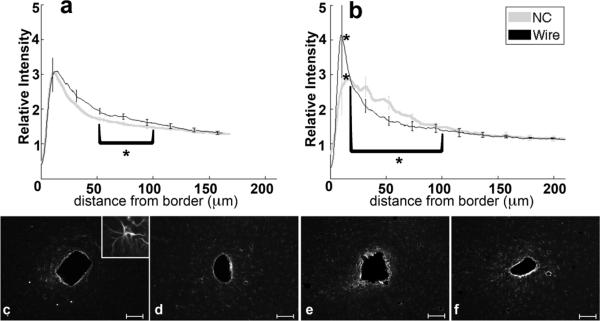
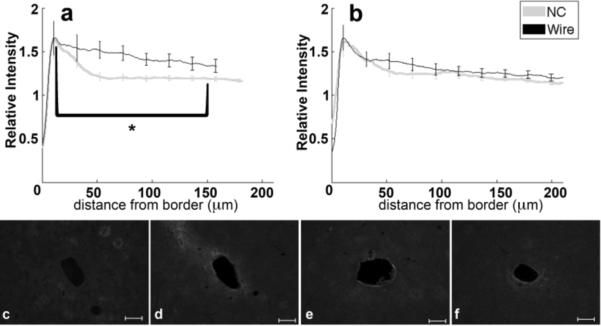
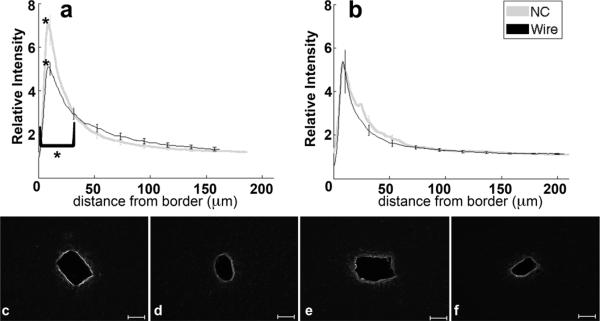
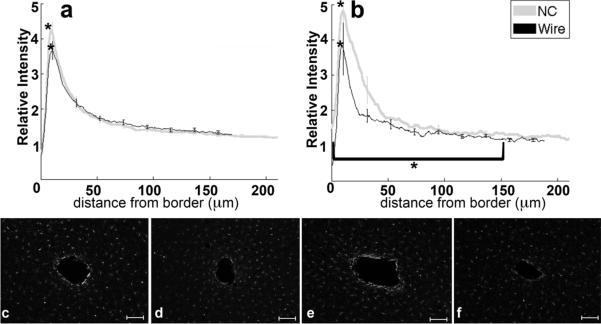
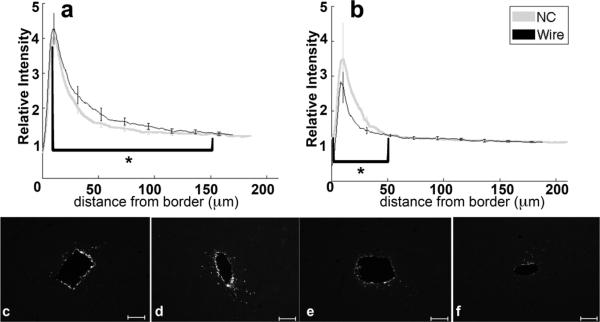
The hypothesis is that the mechanical mismatch between brain tissue and microelectrodes influences the inflammatory response. Our unique, mechanically adaptive polymer nanocomposite enabled this study within the cerebral cortex of rats. The initial tensile storage modulus of 5 GPa decreases to 12 MPa within 15 min under physiological conditions. The response to the nanocomposite was compared to surface-matched, stiffer implants of traditional wires (411 GPa) coated with the identical polymer substrate and implanted on the contralateral side. Both implants were tethered. Fluorescent immunohistochemistry labeling examined neurons, intermediate filaments, macrophages, microglia and proteoglycans. We demonstrate, for the first time, a system that decouples the mechanical and surface chemistry components of the neural response. The neuronal nuclei density within 100 µm of the device at four weeks post-implantation was greater for the compliant nanocomposite compared to the stiff wire. At eight weeks post-implantation, the neuronal nuclei density around the nanocomposite was maintained, but the density around the wire recovered to match that of the nanocomposite. The glial scar response to the compliant nanocomposite was less vigorous than it was to the stiffer wire. The results suggest that mechanically associated factors such as proteoglycans and intermediate filaments are important modulators of the response of the compliant nanocomposite.
Figures
Similar articles
-
In vivo deployment of mechanically adaptive nanocomposites for intracortical microelectrodes.J Neural Eng. 2011 Aug;8(4):046010. doi: 10.1088/1741-2560/8/4/046010. Epub 2011 Jun 8. J Neural Eng. 2011. PMID: 21654037 Free PMC article.
-
Evaluating the in vivo glial response to miniaturized parylene cortical probes coated with an ultra-fast degrading polymer to aid insertion.J Neural Eng. 2018 Jun;15(3):036002. doi: 10.1088/1741-2552/aa9fad. Epub 2018 Feb 27. J Neural Eng. 2018. PMID: 29485103 Free PMC article.
-
Influence of resveratrol release on the tissue response to mechanically adaptive cortical implants.Acta Biomater. 2016 Jan;29:81-93. doi: 10.1016/j.actbio.2015.11.001. Epub 2015 Nov 6. Acta Biomater. 2016. PMID: 26553391 Free PMC article.
-
A review on mechanical considerations for chronically-implanted neural probes.J Neural Eng. 2018 Jun;15(3):031001. doi: 10.1088/1741-2552/aa8b4f. Epub 2017 Sep 8. J Neural Eng. 2018. PMID: 28885187 Review.
-
Regeneration microelectrode array for peripheral nerve recording and stimulation.IEEE Trans Biomed Eng. 1992 Sep;39(9):893-902. doi: 10.1109/10.256422. IEEE Trans Biomed Eng. 1992. PMID: 1473818 Review.
Cited by
-
The Future of Neuroscience: Flexible and Wireless Implantable Neural Electronics.Adv Sci (Weinh). 2021 Mar 9;8(10):2002693. doi: 10.1002/advs.202002693. eCollection 2021 May. Adv Sci (Weinh). 2021. PMID: 34026431 Free PMC article. Review.
-
Compliant intracortical implants reduce strains and strain rates in brain tissue in vivo.J Neural Eng. 2015 Jun;12(3):036002. doi: 10.1088/1741-2560/12/3/036002. Epub 2015 Apr 2. J Neural Eng. 2015. PMID: 25834105 Free PMC article.
-
Advancing the interfacing performances of chronically implantable neural probes in the era of CMOS neuroelectronics.Front Neurosci. 2023 Oct 31;17:1275908. doi: 10.3389/fnins.2023.1275908. eCollection 2023. Front Neurosci. 2023. PMID: 38027514 Free PMC article. Review.
-
The role of oligodendrocytes and their progenitors on neural interface technology: A novel perspective on tissue regeneration and repair.Biomaterials. 2018 Nov;183:200-217. doi: 10.1016/j.biomaterials.2018.08.046. Epub 2018 Aug 22. Biomaterials. 2018. PMID: 30172245 Free PMC article. Review.
-
A softening laminar electrode for recording single unit activity from the rat hippocampus.Sci Rep. 2019 Feb 20;9(1):2321. doi: 10.1038/s41598-019-39835-6. Sci Rep. 2019. PMID: 30787389 Free PMC article.
References
-
- Alberts B. In: Molecular Biology of the Cell. Alberts B, et al., editors. Garland Publishing Inc.; New York, New York: 1994. pp. 948–1009.
-
- Alonso G. NG2 proteoglycan-expressing cells of the adult rat brain: possible involvement in the formation of glial scar astrocytes following stab wound. Glia. 2005;49:318–38. - PubMed
-
- Biran R, Martin DC, Tresco PA. Neuronal cell loss accompanies the brain tissue response to chronically implanted silicon microelectrode arrays. Exp Neurol. 2005;195:115–26. - PubMed
-
- Biran R, Martin DC, Tresco PA. The brain tissue response to implanted silicon microelectrode arrays is increased when the device is tethered to the skull. J Biomed Mater Res A. 2007;82:169–78. - PubMed
Publication types
MeSH terms
Grants and funding
LinkOut - more resources
Full Text Sources
Other Literature Sources