. 2011 Nov 2;31(44):15802-6.
doi: 10.1523/JNEUROSCI.3063-11.2011.

When attention wanders: how uncontrolled fluctuations in attention affect performance

Affiliations

When attention wanders: how uncontrolled fluctuations in attention affect performance

Marlene R Cohen et al. J Neurosci. .

Abstract

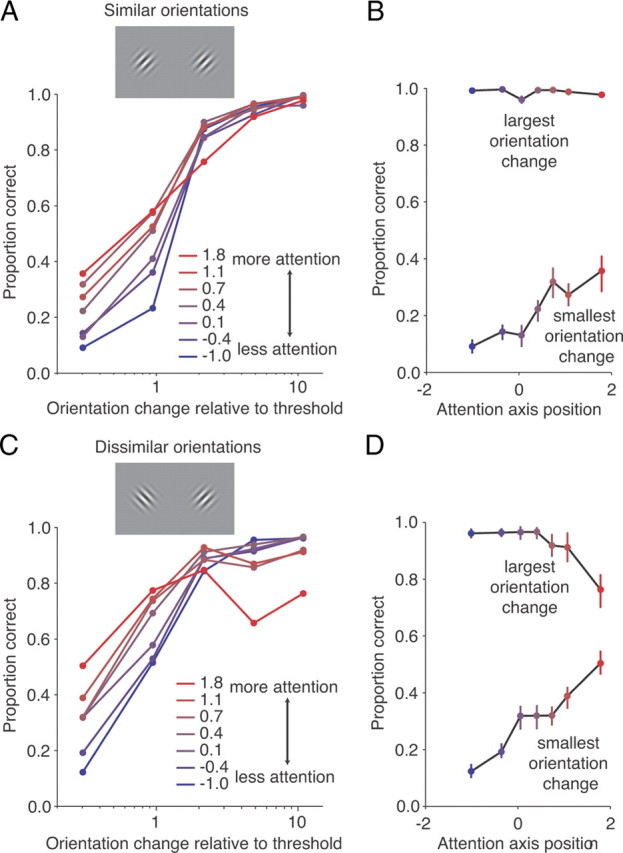
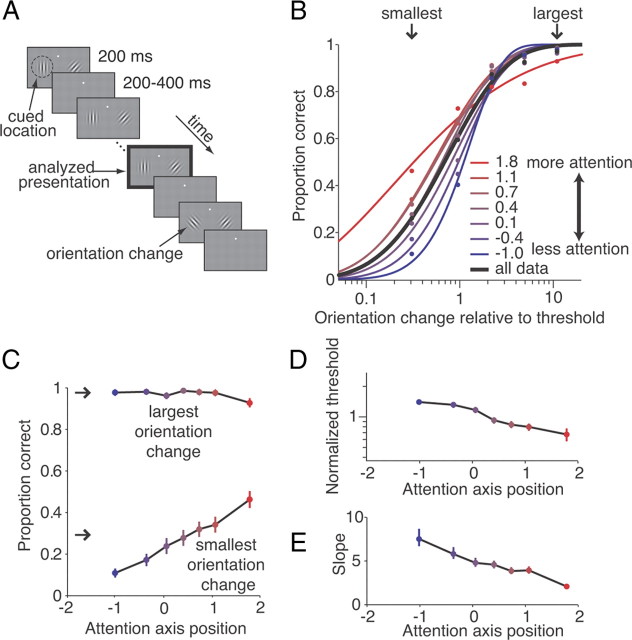
No matter how hard subjects concentrate on a task, their minds wander (Raichle et al., 2001; Buckner et al., 2008; Christoff et al., 2009; Killingsworth and Gilbert, 2010). Internal fluctuations cannot be measured behaviorally or from conventional neurophysiological measures, so their effects on performance have been difficult to study. Previously, we measured fluctuations in visual attention using the responses of populations of simultaneously recorded neurons in macaque visual cortex (Cohen and Maunsell, 2010). Here, we use this ability to investigate how attentional fluctuations affect performance. We found that attentional fluctuations have large and complex effects on performance, the sign of which depends on the difficulty of the perceptual judgment. As expected, attention greatly improves the detection of subtle changes in a stimulus. Surprisingly, we found that attending too strongly to a particular stimulus impairs the ability to notice when that stimulus changes dramatically. Our results suggest that all previously reported measures of behavioral performance should be viewed as amalgamations of different attentional states, whether or not those studies specifically addressed attention.


Figures

Figure 2.
Figure 2.
When the task involves differences in orientation as well as location, strong attention impairs subjects' ability to detect large orientation changes. A, Proportion correct as a function of normalized orientation change sorted by attention axis position as in Figure 1B, for recording sessions in which the orientation of the two stimuli differed by <45° (28/49 recording sessions). B, Proportion correct as a function of position on the attention axis for the largest and smallest orientation change bins. Conventions as in Figure 1C. C, D, Same as A and B for recording sessions in which the orientation of the two stimuli differed by >45° (21/49 recording sessions).
Figure 1.
Figure 1.
Fluctuations in attention change both the thresholds and slopes of psychometric curves. A, Schematic of the orientation change detection task. Two Gabor stimuli synchronously flashed on for 200 ms and off for a randomized 200–400 ms period. At an unsignaled time picked from an exponential distribution (minimum 1000 ms, mean 3000 ms, maximum 5000 ms), one of the stimuli was presented in a different orientation, and the monkey was rewarded for making a saccade to the stimulus that changed. Attention was cued in blocks, and the cue was valid on 80% of trials, meaning that on an “attend-left” block of trials (depicted here), 80% of orientation changes were to the left stimulus. The monkey was rewarded for correctly detecting any change, even on the unattended side. All analyses were performed on responses to the stimulus before the orientation change (black outlined panel). B, Fitted psychometric curves sorted by position on attention axis. Strong attention (red lines and large positive values) improves performance on difficult trials relative to weak attention (blue lines). Arrows indicate the two orientation change bins plotted in C. C, Proportion correct as a function of position on the attention axis for the largest and smallest orientation change bins. Error bars are bootstrapped 95% confidence intervals. D, E, Fitted threshold (D) and slope (E) as a function of attention axis position. Error bars are bootstrapped 95% confidence intervals.

References

    1. Assad JA. Neural coding of behavioral relevance in parietal cortex. Curr Opin Neurobiol. 2003;13:194–197. - PubMed
    1. Buckner RL, Andrews-Hanna JR, Schacter DL. The brain's default network: anatomy, function, and relevance to disease. Ann N Y Acad Sci. 2008;1124:1–38. - PubMed
    1. Cameron EL, Tai JC, Carrasco M. Covert attention affects the psychometric function of contrast sensitivity. Vision Res. 2002;42:949–967. - PubMed
    1. Carrasco M, Penpeci-Talgar C, Eckstein M. Spatial covert attention increases contrast sensitivity across the CSF: support for signal enhancement. Vision Res. 2000;40:1203–1215. - PMC - PubMed
    1. Christoff K, Gordon AM, Smallwood J, Smith R, Schooler JW. Experience sampling during fMRI reveals default network and executive system contributions to mind wandering. Proc Natl Acad Sci U S A. 2009;106:8719–8724. - PMC - PubMed

Publication types