. 2012 May;166(1):390-400.
doi: 10.1111/j.1476-5381.2011.01769.x.

Role of ion channels in sepsis-induced atrial tachyarrhythmias in guinea pigs

Affiliations

Role of ion channels in sepsis-induced atrial tachyarrhythmias in guinea pigs

Yuta Aoki et al. Br J Pharmacol. 2012 May.

Abstract

Background and purpose: Supraventricular tachyarrhythmias, including atrial fibrillation, are occasionally observed in patients suffering from sepsis. Modulation of cardiac ion channel function and expression by sepsis may have a role in the genesis of tachyarrhythmias.

Experimental approach: Sepsis was induced by LPS (i.p.; 300 µg·kg(-1) ) in guinea pigs. Membrane potentials and ionic currents were measured in atrial myocytes isolated from guinea pigs 10 h after LPS, using whole cell patch-clamp methods.

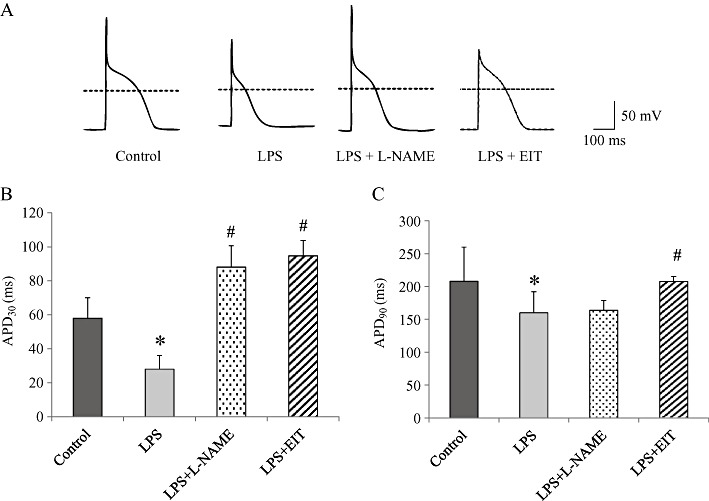
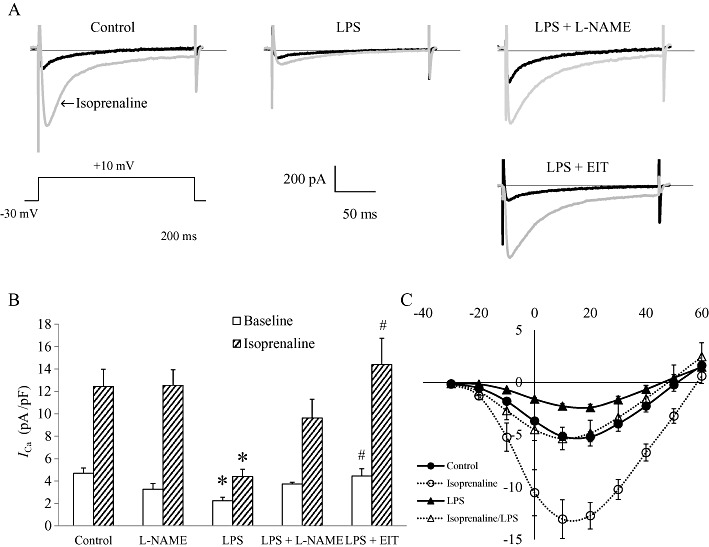
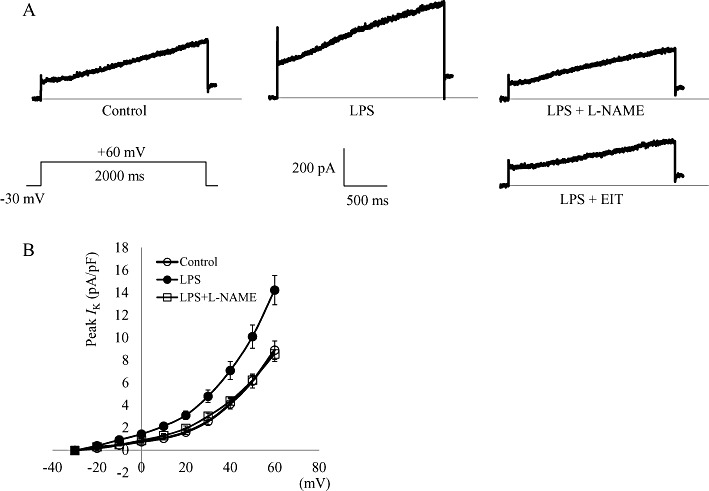
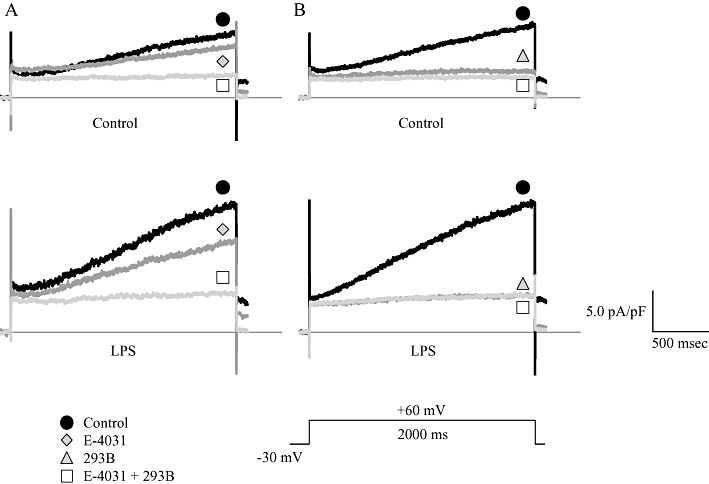
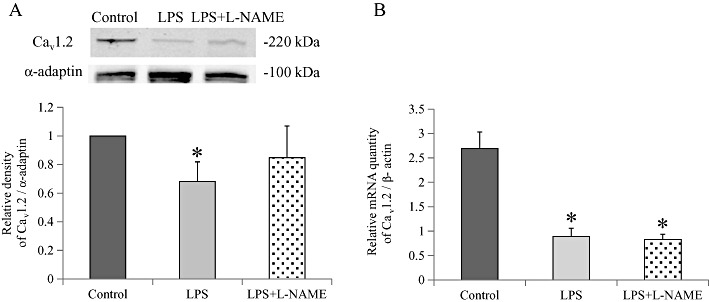
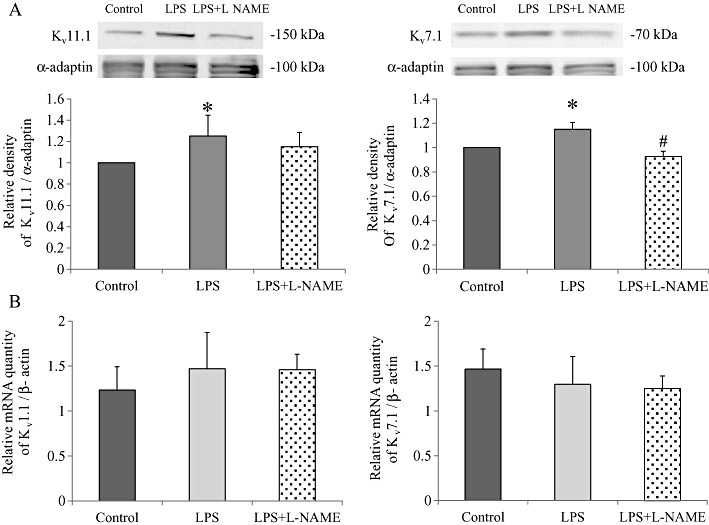
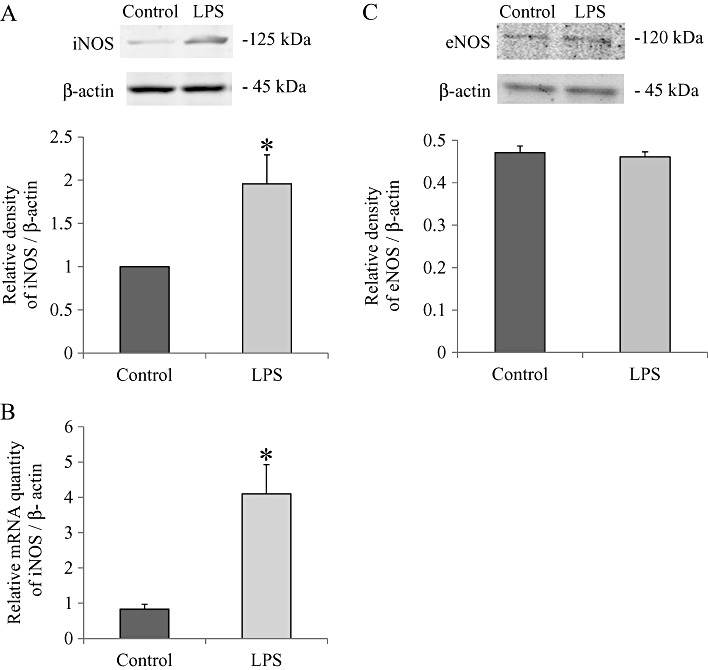
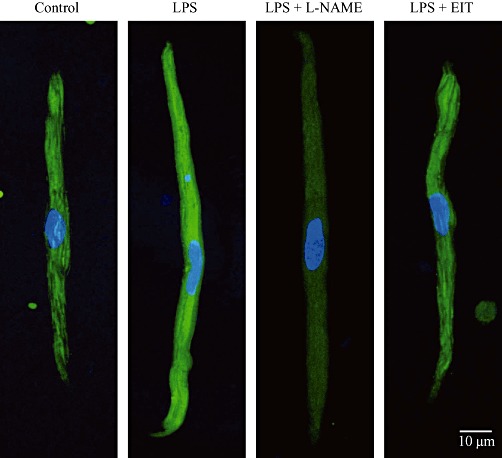
Key results: In atrial cells from LPS-treated animals, action potential duration (APD) was significantly shortened. It was associated with a reduced L-type Ca(2+) current and an increased delayed rectifier K(+) current. These electrophysiological changes were eliminated when N(G) -nitro-l-arginine methyl ester (l-NAME) or S-ethylisothiourea was given together with LPS. In atrial tissues from LPS-treated animals, Ca(2+) channel subunits (Ca(v) 1.2 and Ca(v) 1.3) decreased and delayed rectifier K(+) channel subunits (K(v) 11.1 and K(v) 7.1) increased. However, L-NAME treatment did not substantially reverse such changes in atrial expression in LPS-treated animals, with the exception that K(v) 11.1 subunits returned to control levels. After LPS injection, inducible NOS in atrial tissues was up-regulated, and atrial NO production clearly increased.

Conclusions and implications: In atrial myocytes from guinea pigs with sepsis, APD was significantly shortened. This may reflect nitration of the ion channels which would alter channel functions, rather than changes in atrial expression of the channels. Shortening of APD could serve as one of the mechanisms underlying atrial tachyarrhythmia in sepsis.


Figures

Figure 1
Figure 1
Action potentials in atrial myocytes from control and LPS-challenged guinea pigs. Action potentials were elicited by current injection at a rate of 2 Hz. Animals treated with l-NAME or EIT received i.p. injections of l-NAME or EIT, at the same time as LPS. (A) Typical traces of action potentials are shown. (B, C) Bar graphs comparing APD30 and APD90 in atrial myocytes from control, LPS-treated, LPS/l-NAME-treated and LPS/EIT-treated animals. Data shown are means ± SEM of 10 cells from at least three different guinea pigs. *P < 0.05 significantly different from control. #P < 0.05 significantly different from LPS alone.
Figure 2
Figure 2
Basal and isoprenaline-stimulated ICa in atrial myocytes from control and LPS-challenged guinea pigs with and without l-NAME or EIT treatment. (A) Current traces before and 5 min after exposure to 100 nM isoprenaline are superimposed. ICa was elicited by a 200 ms depolarizing test pulse to +10 mV from a holding potential of 30 mV. (B) Bar graph comparing basal and isoprenaline-stimulated ICa elicited by a depolarizing pulse from 30 to +10 mV in atrial myocytes from control, l-NAME-treated, LPS-treated and LPS/l-NAME-treated animals. *P < 0.05 significantly different from control. #P < 0.05 significantly different from LPS alone. (C) Current–voltage relations for control and septic atrial myocytes before and after exposure to 100 nM isoprenaline. There were significant differences between control and septic current–voltage relation curves in both the absence and presence of isoprenaline (P < 0.05). Data shown are means ± SEM of 10 cells from at least three different guinea pigs.
Figure 3
Figure 3
Effect of treatment with l-NAME or EIT on the change in IK in atrial myocytes from LPS-challenged guinea pigs. (A) Typical tracings of IK elicited by a 2 s depolarizing test pulse to +60 mV from a holding potential of 30 mV. (B) Current–voltage relations in atrial myocytes from control, LPS-treated and LPS/L-NAME-treated animals. In this current–voltage relation curves, significant differences were found between control and LPS-treated animals (P < 0.05), and also between LPS-treated and LPS/l-NAME-treated animals (P < 0.05). Data shown are means ± SEM of 10 cells from at least three different guinea pigs.
Figure 4
Figure 4
Changes in IK in the presence of the IKr inhibitor E-4031 and/or the IKs inhibitor chromanol 293B in atrial myocytes from control and LPS-challenged guinea pigs. (A) Cells were initially given 5 µM E-4031 followed by 30 µM chromanol 293B. (B) Cells were initially given 30 µM chromanol 293B followed by 5 µM E-4031.
Figure 5
Figure 5
Changes in atrial expression of the Ca2+ channel subunit Cav1.2 in LPS-challenged guinea pigs. (A) Atrial expression of Cav1.2 protein levels in control and LPS-challenged guinea pigs was compared with the relative level using the endocytic protein α-adaptin. Typical Western blots of Cav1.2 and α-adaptin are shown in the top trace. Data shown are means ± SEM of four separate experiments. *P < 0.05 significantly different from control. (B) Real-time PCR analysis of Cav1.2 mRNA expression in atrial tissues from control, LPS-treated, and LPS/l-NAME-treated animals. The Cav1.2 mRNA levels are normalized to β-actin mRNA levels. Data shown are means ± SEM of six separate experiments. *P < 0.05 significantly different from control.
Figure 6
Figure 6
Changes in atrial expression of delayed rectifier K+ channel subunits (Kv11.1 and Kv7.1) in LPS-challenged guinea pigs. (A) Atrial expression of delayed rectifier K+ channel subunit protein levels in control and LPS-challenged guinea pigs was compared with the endocytic protein α-adaptin. Typical Western blots of Kv11.1, Kv7.1, and α-adaptin are shown in the top trace. Data shown are means ± SEM of six separate experiments. *P < 0.05 significantly different from control. #P < 0.05 significantly different from LPS alone. (B) Real-time PCR analysis of delayed rectifier K+ channel subunit mRNA expression in atrial tissues from control, LPS-treated and LPS/l-NAME-treated guinea pigs. The delayed rectifier K+ channel subunit mRNA levels are normalized to β-actin mRNA levels. Data shown are means ± SEM of six separate experiments. No significant differences in the atrial expression of delayed rectifier K+ channel subunit mRNA among groups was noted.
Figure 7
Figure 7
Changes in atrial expression of iNOS and eNOS in LPS-challenged guinea pigs. (A) Atrial expression of iNOS protein levels in control and LPS-challenged guinea pigs was compared with the housekeeping protein β-actin. Typical Western blots of iNOS and β-actin are shown in the top trace. Data shown are means ± SEM of three separate experiments. *P < 0.05 significantly different from control. (B) Real-time PCR analysis of iNOS mRNA expression in atrial tissues from control and LPS-challenged guinea pigs. The iNOS mRNA levels are normalized to β-actin mRNA levels. Data shown are means ± SEM of six separate experiments. *P < 0.05 significantly different from control. (C) Atrial expression of eNOS protein levels in control and LPS-challenged guinea pigs was compared with β-actin. Typical Western blots of eNOS and β-actin are shown in the top trace. Data shown are means ± SEM of four separate experiments.
Figure 8
Figure 8
NO production by atrial cells from control and LPS-challenged guinea pigs. When the animals were treated with l-NAME or EIT, i.p. injection of l-NAME or EIT was given together with LPS. Intracellular NO is visualized with the use of the NO-sensitive dye DAF-2 DA (green). Nuclei were stained with Hoechst 33258 (blue). Representative images from two separate experiments are shown.

Similar articles

Cited by

References

    1. Abi-Gerges N, Tavernier B, Mebazaa A, Faivre V, Paqueron X, Payen D, et al. Sequential changes in autonomic regulation of cardiac myocytes after in vivo endotoxin injection in rat. Am J Respir Crit Care Med. 1999;160:1196–1204. - PubMed
    1. Alexander SPH, Mathie A, Peters JA. Guide to Receptors and Channels (GRAC), 5th Edition. Br J Pharmacol. 2011;164(Suppl. 1):S1–S324. - PMC - PubMed
    1. Artucio H, Perrier M. Cardiac arrhythmias in critically ill patients: epidemiologic study. Crit Care Med. 1990;18:1383–1388. - PubMed
    1. Bai C-X, Takahashi K, Masumiya H, Sawanobori T, Furukawa T. Nitric oxide-dependent modulation of the delayed rectifier K+ current and the L-type Ca2+ current by ginsenoside Re, an ingredient of Panax ginseng, in guinea-pig cardiomyocytes. Br J Pharmacol. 2004;142:567–575. - PMC - PubMed
    1. Bai C-X, Namekata I, Kurokawa J, Tanaka H, Shigenobu K, Furukawa T. Role of nitric oxide in Ca2+ sensitivity of the slowly activating delayed rectifier K+ current in cardiac myocytes. Circ Res. 2005;96:64–72. - PubMed

Publication types

MeSH terms