. 2011 Nov 3:10:198.
doi: 10.1186/1476-511X-10-198.

Apoptosis, mastocytosis, and diminished adipocytokine gene expression accompany reduced epididymal fat mass in long-standing diet-induced obese mice

Affiliations

Apoptosis, mastocytosis, and diminished adipocytokine gene expression accompany reduced epididymal fat mass in long-standing diet-induced obese mice

Mehmet M Altintas et al. Lipids Health Dis. .

Abstract

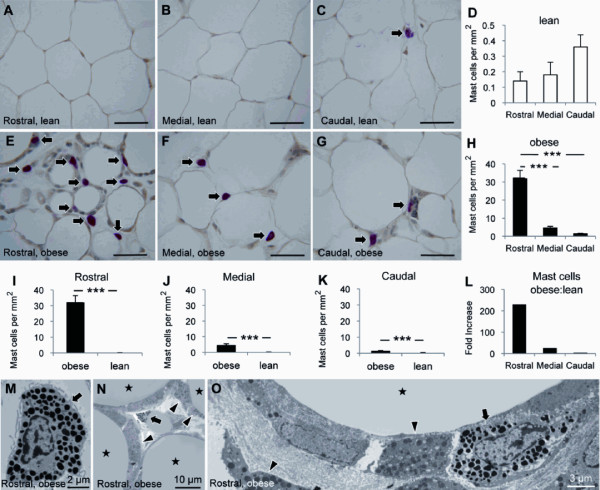
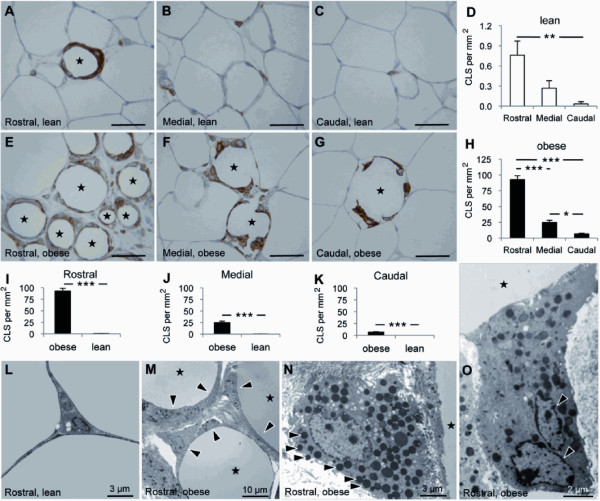
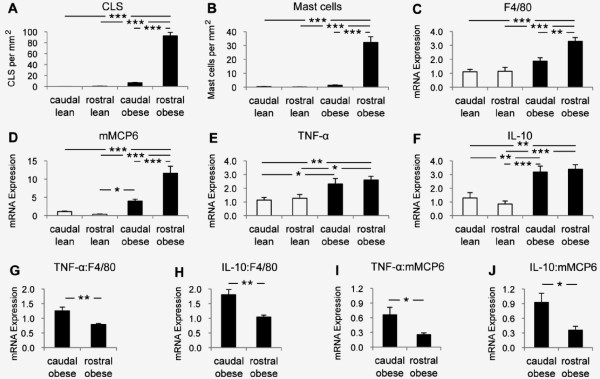
Background: Obesity is characterized by increased cell death and inflammatory reactions in the adipose tissue. Here, we explored pathophysiological alterations taking place in the adipose tissue in long-standing obesity. In the epididymal fat of C57BL/6 mice fed a high-fat diet for 20 weeks, the prevalence and distribution of dead adipocytes (crown-like structures), mast cells (toluidine blue, mMCP6), macrophages (F4/80), and apoptotic cells (cleaved caspase-3) were measured. Moreover, gene and/or protein expression of several adipocytokines (leptin, adiponectin, TNF-α, IL-10, IL-6, MCP-1), F4/80, mMCP6, cleaved caspase-3 were determined.

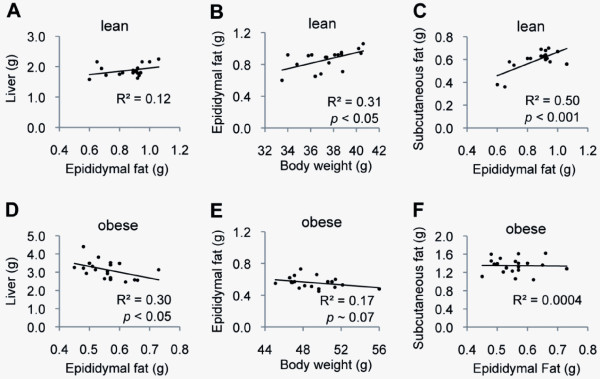
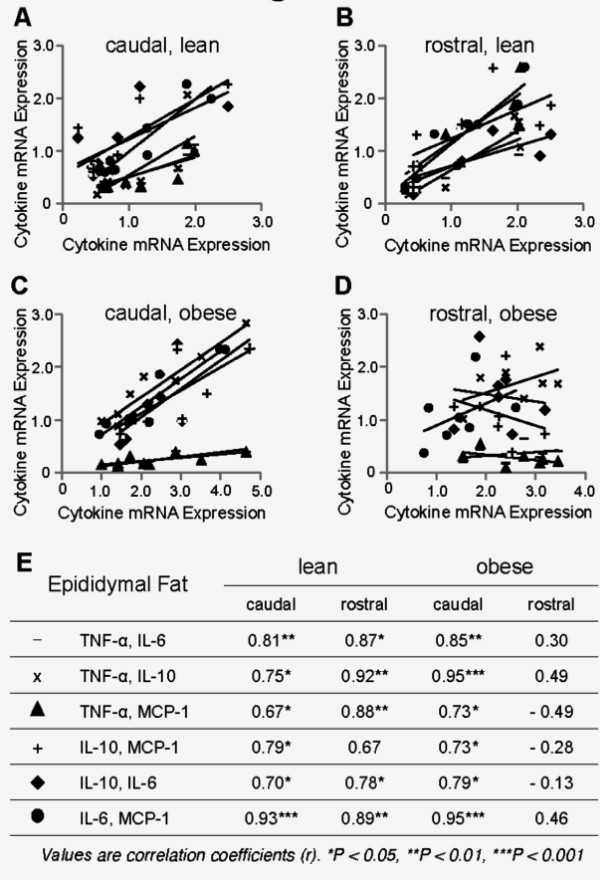
Results: We observed that the epididymal fat mass was lower in obese than in lean mice. In obese mice, the epididymal fat mass correlated inversely with body weight and liver mass. Dead adipocytes, mast cells, macrophages, and apoptotic cells were abundant in the epididymal fat of obese mice, especially in the rostral vs. caudal zone. Accordingly, mMCP6, F4/80, and cleaved caspase-3 gene and/or protein expression was increased. Conversely, adiponectin, leptin, IL-6, and MCP-1 gene expression levels were lower in the epididymal fat of obese than lean mice. Although TNF-α and IL-10 gene expression was higher in the epididymal fat of obese mice, their expression relative to F4/80 and mMCP6 expression were lower in the heavily infiltrated rostral than caudal zone.

Conclusions: This study demonstrates that in mice with long-standing obesity diminished gene expression of several adipocytokines accompany apoptosis and reduced mass of the epididymal fat. Our findings suggest that this is due to both increased prevalence of dead adipocytes and altered immune cell activity. Differential distribution of metabolically challenged adipocytes is indicative of the presence of biologically diverse zones within the epididymal fat.


Figures

Figure 1
Figure 1
The epididymal fat in the male mouse. To demonstrate abdominal organs, the anterior abdominal wall was removed and the left epididymal fat (1) was deflected to the left. The epididymal fat was divided into a caudal, medial, and rostral zone relative to the location of spermatic blood vessels (2). The left testis (3), the urinary bladder (4), a small bowel loop (5), and attached mesenteric fat (6) are also shown.
Figure 2
Figure 2
The body weight and the weights of the epididymal and inguinal subcutaneous fat depots. Relations between the body weight and the weights of the epididymal and inguinal fat depots in lean (A-C) and longstanding obese (D-F) mice are shown. The weight of the epididymal fat correlated inversely with the weight of the liver and the body weight in long-standing obese mice.
Figure 3
Figure 3
Differential distribution of mast cells in the epididymal fat. The distribution of mast cells in the epididymal fat from lean (A-D) and diet-induced obese (E-H) mice (n = 10 per group) are shown. The density of mast cells in the rostral, medial, and caudal epididymal fat was compared between lean and obese mice (I-L). Ultrastructural examination revealed frequent mast cells (arrows) intermingled with macrophages (arrowheads) in the expanded interstitial space between adipocytes (stars) in obese mice (M-O). Scale bars: 50 μm or as indicated. *** p < 0.001.
Figure 4
Figure 4
Mouse mast protease-6 (mMCP6) expression in the epididymal fat. Western blot analysis of mMCP6 protein expression in the rostral and caudal epididymal fat from lean (n = 4, white bars) and diet-induced obese (n = 4, black bars) mice is shown (A-D). Correlations between mMCP6 and macrophage-specific F4/80 gene expression are also demonstrated (E-H). * p < 0.05, ** p < 0.01.
Figure 5
Figure 5
Differential distribution of crown-like structures (CLS) in the epididymal fat. The densities of CLS in the epididymal fat from lean (A-D) and diet-induced obese (E-H) mice (n = 10 per group) are shown. The density of CLS in the rostral, medial, and caudal epididymal fat was compared between lean and obese mice (I-K). Ultrastructural examination demonstrated a delicate interstitium in the epididymal fat from lean mice (L). In obese mice, the expanded interstitial space contained macrophages (arrowheads), many of which enveloped scattered adipocytes forming CLS (stars) (M). While many macrophages were packed with lipid droplets (N), some were multinucleated (O). Scale bars: 50 μm or as indicated. * p < 0.05, ** p < 0.01, *** p < 0.001.
Figure 6
Figure 6
Adipocytokine gene expression and apoptosis in the epididymal fat. Ultrastructural examination of the epididymal fat from diet-induced obese mice demonstrated frequent macrophages (arrowheads) and mast cells (arrow) abutting lipid cores (star) with no evidence of the cytoplasm of adipocytes (A). The expression of cleaved caspase-3 was determined by immunostaining (arrows, B-E) and Western blot analysis (F-G). Leptin, adiponectin, IL-6, and MCP-1 gene expression was determined in the caudal and rostral epididymal fat from lean (white bars) and obese (black bars) mice (H-K). Scale bars: 50 μm or as indicated. * p < 0.05, ** p < 0.01, *** p < 0.001.
Figure 7
Figure 7
TNF-α and IL-10 gene expression in the epididymal fat. The distribution of CLS and mast cells and the expression of F4/80, mMCP6, TNF-α and IL-10 genes in the caudal and rostral epididymal fat from lean (white bars) and diet-induced obese (black bars) mice are shown (A-F). TNF-α and IL-10 gene expression relative to F4/80 and mMCP6 gene expression is also shown (G-J) * p < 0.05, ** p < 0.01, *** p < 0.001.
Figure 8
Figure 8
Interrelationship between inflammatory cytokines in the epididymal fat. The correlations among expression levels of TNF-α, IL-10, IL-6, and MCP-1 genes in the caudal and rostral epididymal fat from lean and diet-induced obese mice are shown.

References

    1. Shoelson SE, Lee J, Goldfine AB. Inflammation and insulin resistance. J Clin Invest. 2006;116:1793–801. doi: 10.1172/JCI29069. - DOI - PMC - PubMed
    1. Xu H, Barnes GT, Yang Q, Tan G, Yang D, Chou CJ, Sole J, Nichols A, Ross JS, Tartaglia LA, Chen H. Chronic inflammation in fat plays a crucial role in the development of obesity-related insulin resistance. J Clin Invest. 2003;112:1821–1830. - PMC - PubMed
    1. Altintas MM, Azad A, Nayer B, Contreras G, Zaias J, Faul C, Reiser J, Nayer A. Mast cells, macrophages, and crown-like structures distinguish subcutaneous from visceral fat in mice. J Lipid Res. 2011;52:480–488. doi: 10.1194/jlr.M011338. - DOI - PMC - PubMed
    1. Liu J, Divoux A, Sun J, Zhang J, Clément K, Glickman JN, Sukhova GK, Wolters PJ, Du J, Gorgun CZ, Doria A, Libby P, Blumberg RS, Kahn BB, Hotamisligil GS, Shi GP. Genetic deficiency and pharmacological stabilization of mast cells reduce diet-induced obesity and diabetes in mice. Nat Med. 2009;15:940–945. doi: 10.1038/nm.1994. - DOI - PMC - PubMed
    1. Elgazar-Carmon V, Rudich A, Hadad N, Levy R. Neutrophils transiently infiltrate intra-abdominal fat early in the course of high-fat feeding. J Lipid Res. 2008;49:1894–1903. doi: 10.1194/jlr.M800132-JLR200. - DOI - PubMed

Publication types

MeSH terms