

Different iron-deposition patterns of multiple system atrophy with predominant parkinsonism and idiopathetic Parkinson diseases demonstrated by phase-corrected susceptibility-weighted imaging
- PMID: 22051807
- PMCID: PMC7964805
- DOI: 10.3174/ajnr.A2765
Different iron-deposition patterns of multiple system atrophy with predominant parkinsonism and idiopathetic Parkinson diseases demonstrated by phase-corrected susceptibility-weighted imaging
Abstract
Background and purpose: MSA-P and IPD have similar clinical presentations that may complicate accurate clinical diagnosis. Different iron-deposition patterns of those 2 diseases have been demonstrated in histopathology. The aim was to demonstrate the different iron-deposition patterns of MSA-P and IPD by using SWI phase images.
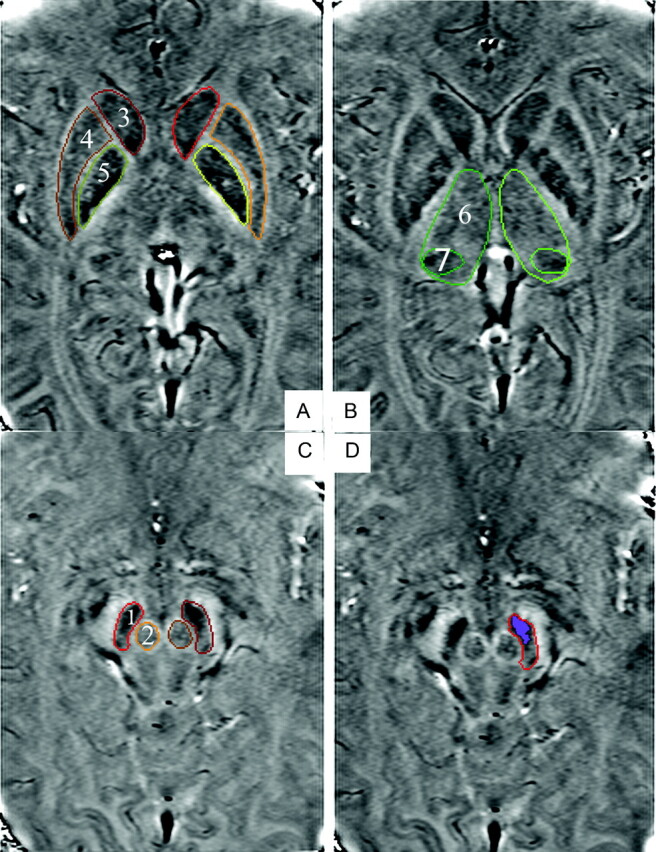
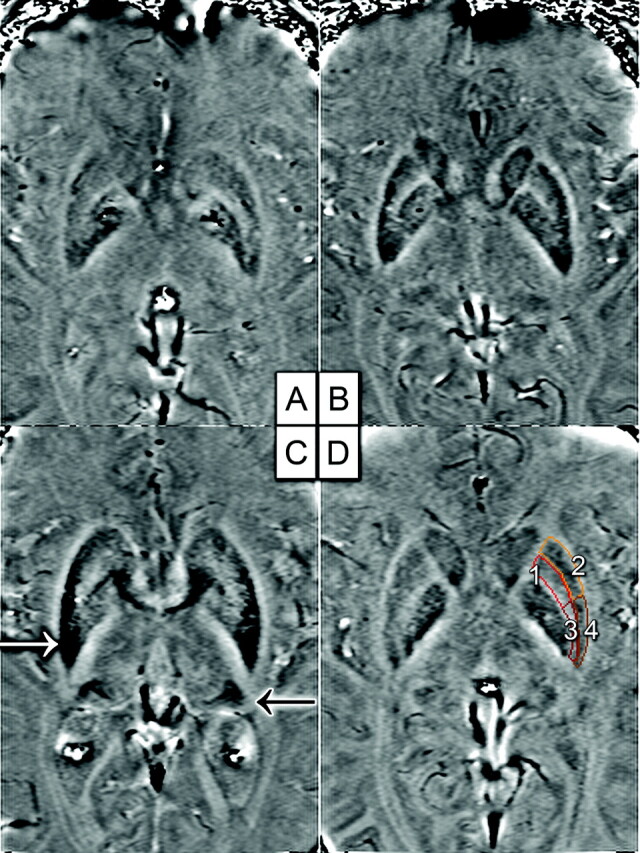
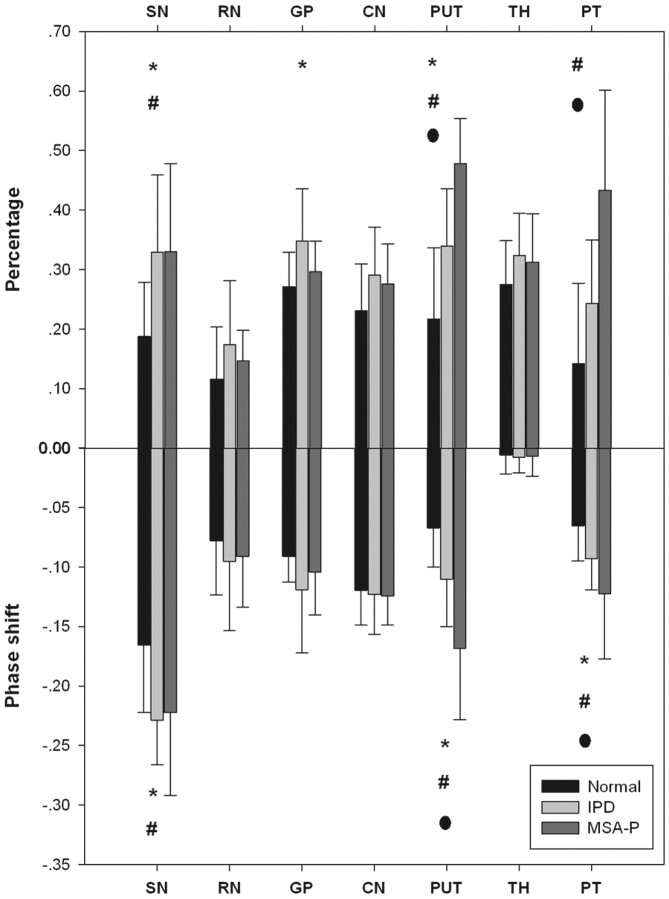
Materials and methods: Sixteen patients with IPD, 8 with MSA-P, and 44 age-matched healthy controls underwent SWI of brain. The different phase shifts as well as the high iron percentage of the area in several gray nuclei were statistically evaluated. The putamen was divided into 4 subregions for further analysis.
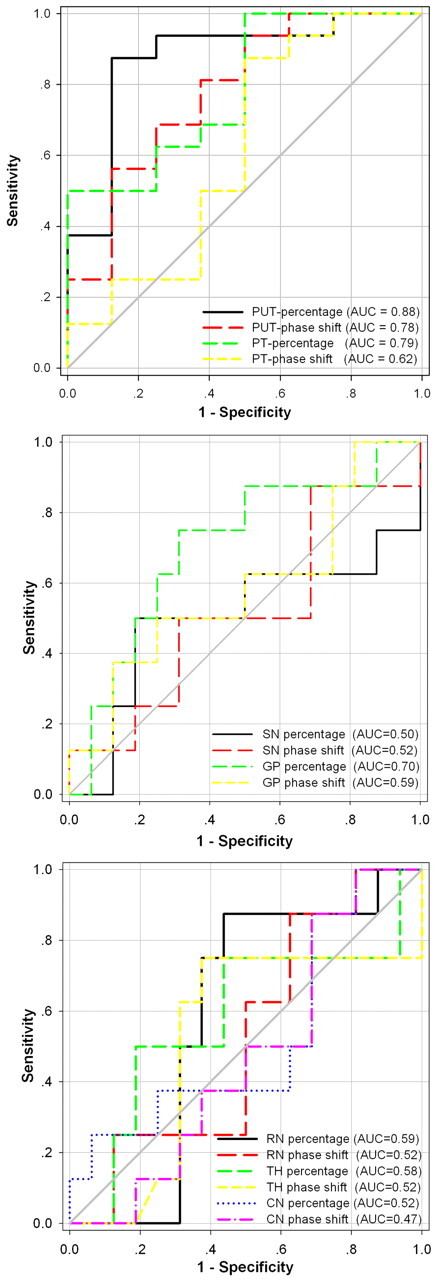
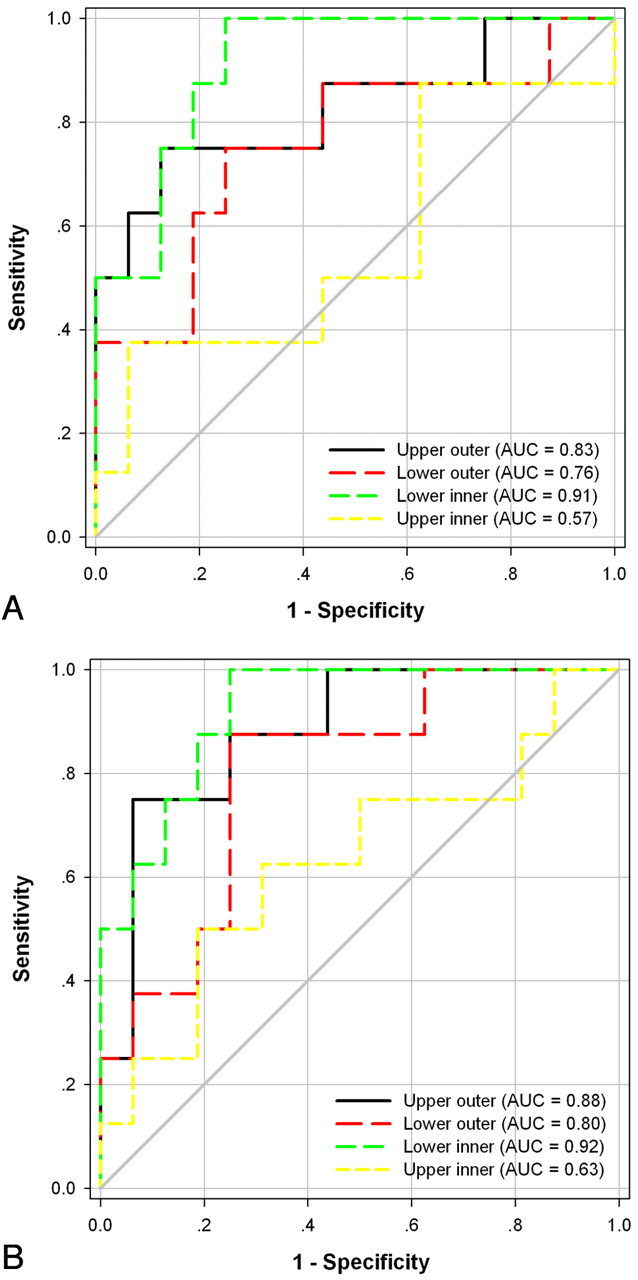
Results: Patients with MSA-P had significantly higher iron deposition in the putamen and PT compared with those with IPD (P < .05). Moreover, ROC curves indicated slightly more sensitivity in differentiating MSA-P from IPD, by means of the high-iron-deposition-percentage area than the average phase shift (putamen: AUC = 0.88 versus 0.78; PT: AUC = 0.79 versus 0.62). Moreover, the lower inner region of the putamen was the most valuable subregion in differentiating MSA-P from IPD among the 4 subregions (AUC = 0.92 and 0.91 for high-iron-percentage area and average phase shift, respectively).
Conclusions: Higher iron deposition in the putamen and PT may differentiate MSA-P from IPD, but the lower inner region of the putamen may be better compared with the PT and other subregions of the putamen. Moreover, the high iron percentage makes it possible to detect smaller increases in iron content more confidently in comparison with average phase shift.
Figures
References
-
- Thomas M, Jankovic J. Neurodegenerative disease and iron storage in the brain. Curr Opin Neurol 2004; 17: 437– 42 - PubMed
-
- Zhu WZ, Zhong WD, Wang W, et al. . Quantitative MR phase-corrected imaging to investigate increased brain iron deposition of patients with Alzheimer disease. Radiology 2009; 253: 497– 504 - PubMed
-
- Berg D, Hochstrasser H. Iron metabolism in Parkinsonian syndromes. Mov Disord 2006; 21: 1299– 310 - PubMed
Publication types
MeSH terms
Substances
LinkOut - more resources
Full Text Sources
Medical