. 2012 Oct;22(10):2227-40.
doi: 10.1093/cercor/bhr290. Epub 2011 Nov 2.

Cortical parcellations of the macaque monkey analyzed on surface-based atlases

Affiliations

Cortical parcellations of the macaque monkey analyzed on surface-based atlases

David C Van Essen et al. Cereb Cortex. 2012 Oct.

Abstract

Surface-based atlases provide a valuable way to analyze and visualize the functional organization of cerebral cortex. Surface-based registration (SBR) is a primary method for aligning individual hemispheres to a surface-based atlas. We used landmark-constrained SBR to register many published parcellation schemes to the macaque F99 surface-based atlas. This enables objective comparison of both similarities and differences across parcellations. Cortical areas in the macaque vary in surface area by more than 2 orders of magnitude. Based on a composite parcellation derived from 3 major sources, the total number of macaque neocortical and transitional cortical areas is estimated to be about 130-140 in each hemisphere.


Figures

Figure 1.
Figure 1.
Landmarks for SBR displayed on the F99 atlas and an individual subject right hemisphere. (A) Lateral views of the F99 atlas midthickness (top), inflated (middle), and spherical (bottom) surfaces. Fifteen landmark contours are projected to the surface. (B) Corresponding lateral views of an individual macaque (Case CH from Kolster et al. 2009) generated using the FreeSurfer processing pipeline followed by a semiautomated pipeline in Caret. After conversion to Caret format, the individual-subject surface was inflated, mapped to a sphere, processed by multiresolution morphing to reduce distortions and rotated to a spherical standard orientation. A standard set of template landmark contours (originally generated on a different hemisphere and stored as contour points relative to that hemisphere’s spherical standard surface) was projected to the spherical standard surface and viewed on other configurations (pre-edit landmarks on the inflated surface). Manual editing yielded post-edit contours shown in the other panels. (C) Medial views of the atlas surface. Revised medial wall borders, compared with earlier version of the F99 atlas (Van Essen and Dierker 2007) include the boundary between neocortex or transitional cortex and basal forebrain, piriform cortex, and other non-neocortical structures. (D) Medial views of the individual surface.
Figure 2.
Figure 2.
Key stages in LVD registration, using an exemplar individual (source) hemisphere registered to the F99 atlas target. (A, B) Landmark contours on source (case CH of Kolster et al. 2009) and target (F99 atlas) spheres after resampling to match the number of contour points in corresponding source and target landmarks. (C) Expanded views of surface mesh in the calcarine sulcus, showing landmark nodes (red) intercalated into the 74 k node spherical mesh. The surface was extensively smoothed and projected back to a sphere, which caused compression of tiles in the vicinity of the 12 nodes that have only 5 (instead of 6) neighbors. This was important in order to avoid smoothing-induced distortions at intermediate stages of the deformation process. (D) Expanded views of target nodes intercalated into an equivalent mesh at the locations of the resampled target landmarks. Red arrows in C and D indicate displacement vectors computed for the highlighted landmark nodes (black). (E) Y-component of the smoothed displacement field. Yellow–orange signifies nodes to be displaced to the left (positive y), blue signifies nodes to be displaced to the right. (F) Deformed surface mesh at the end of stage 1, which includes 2 cycles of displacement, smoothing, and morphing, resulting in displacement of the mesh about one-third of the distance to the target. To transfer these results to the native-mesh surface in preparation for the next stage, each node from the native-mesh source sphere is projected to the initial landmark-intercalated source sphere (panel C) then unprojected based on its location in the deformed landmark-intercalated source sphere (panel F). (The projection and unprojection steps use barycentric coordinates to specify the position of nodes in one mesh relative to the nearest tile of the other mesh—see Fig. 3E). This deformed native-mesh sphere becomes the input source sphere for the next stage of the LVD process. (G) A fresh surface mesh at the beginning of stage 2. Landmark nodes preserve their location from the end of stage 1 (panel F) but are intercalated into an undistorted spherical mesh (as in panel C but with shifted location of landmark nodes). (H) Alignment of source calcarine sulcus landmarks after 5 stages of LVD registration. The similarity of landmark node positions in panels D and H signifies successful registration.
Figure 3.
Figure 3.
Individual midthickness surface represented using native mesh and atlas mesh tessellations. (A) Native-mesh midthickness surface (top) and expanded to reveal the native mesh with one node highlighted (bottom panel). (B) The native-mesh spherical surface with landmarks, centered on the highlighted node (top panel) and expanded to show the preregistration spherical mesh (bottom panel). (C) The deformed native-mesh sphere, with landmarks precisely aligned to those of with the target spherical. (D) Target (atlas) spherical landmarks. (E) Target spherical nodes overlaid on deformed source spherical mesh. A source-to-target deformation map specifies the barycentric coordinates of each target node (e.g., red node) relative to the nearest tile in the deformed native-mesh sphere (e.g., blue nodes). (F) A resampled (74k_f99) individual subject midthickness surface is generated by positioning each target node based on its barycentric coordinates relative to the native-mesh midthickness surface.
Figure 4.
Figure 4.
Geographic correspondences and areal distortion maps for different stages of spherical registration using LVD Landmark-SBR. (A) Highlighted nodes (black squares) indicated corresponding geographic locations in the individual (top) and atlas (bottom) midthickness surfaces, each shaded by is own map of cortical folding. (B) Ratio between the surface area of each atlas midthickness tile and the corresponding tile in the registered and resampled individual surface. (C) Distortion map between individual sphere and its 3D midthickness surface (top) and between F99 atlas sphere and its 3D midthickness surface (bottom). The individual sphere versus midthickness distortion map is based on the Caret-generated (multiresolution morphing) sphere, whose distortions differ from the FreeSurfer process. (D) Distortion map and between atlas and individual spheres, showing the local distortions needed to align source and target landmarks.
Figure 5.
Figure 5.
Preparatory steps for Landmark-SBR of a partial hemisphere reconstruction. (A) Anterior view of 3D anatomical surface of macaque case om43, with landmarks drawn along gyral and sulcal landmarks and along perimeter of prefrontal cortex. (B) Inflated surface generated using a combination of smoothing iterations and expansion from the center of gravity. A cut along the principal sulcus (gap at top) reduced distortions in the cortical flat map (not shown). (C) A partial sphere generated by 1) projecting all nodes in the inflated surface to a fixed radius, 2) reducing distortions relative to the 3D anatomical surface using spherical morphing, 3) applying a spherical compression step that shifts all nodes in the front portion to subtend a solid angle approximately matching that of the target atlas landmarks, and 4) rotating the compressed sphere into approximate alignment with the atlas. (D) Corresponding landmarks on the F99 atlas anatomical surface. (E) Target landmarks on the F99 atlas sphere.
Figure 6.
Figure 6.
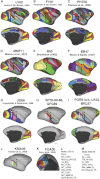
Cortical areas from 15 parcellations mapped to the F99 atlas surface. (AK) Areas for one or more nonoverlapping parcellations, presented in the same sequence as in Table 1. (L, M) Areas identified for the white (panel L) and black (panel M) nodes highlighted in panels AJ. Each area is identified using a standard format: <area-name>_<parcellation>.
Figure 7.
Figure 7.
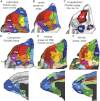
Comparing OMPFC areas in the FOA00 and PHT00 parcellations. (A) Ventral view of orbital cortex an individual subject (case om43 of Ferry et al. 2000). (B) Case om43 areas registered to the F99 atlas. (C) Probabilistic areas 13a, Iai, and 11l (n = 5 hemispheres). (D) Composite map of FOA00 areas on ventral (top) and medial (bottom) views. (E) FOA00 composite borders overlaid on PHT00 areas registered to F99 atlas. (F) PHT00 areas on ventral and medial views of the reconstructed PHT00 atlas surface (Paxinos and Franklin 2000).
Figure 8.
Figure 8.
Comparison of macaque area MT size and location across multiple studies. (A) Area MT (red) from FV91 (Felleman and Van Essen 1991), based on myeloarchitectonic MT on inflated F99 atlas, with posterior bank of the STS highlighted (white squares). MT is several-fold longer than wide when visualized in 3D space (see Fig. 5, Van Essen et al. 1981) or on the midthickness surface, but it appears more highly elongated in Figure 8 owing to anisotropies that occur during surface inflation. (B) FV91 visual areas with black contour outlining MT on the very inflated atlas surface. (CH) Cortical areas from 6 other parcellation schemes, with MT as read and FV91 MT outlined (black contour). (C) LV00 = Lewis and Van Essen (2000). (D) UD86 = Ungerleider and Desimone (1986). (E) LK02 = Lyon and Kaas (2002). (F) PHT00—Paxinos and Franklin (2000). (G) MMF11 = Markov et al. (2011). (H) Probabilistic area MT from KMA09 = Kolster et al. (2009, n = 4). (I) STS parcellation of KMA09. (J, K) KMA09 parcellations from the left and right hemispheres of case CH (panel K) and case TO (panel J), with the composite borders of MT and MTp outlined. MTp was identified as a distinct visuotopic map labeled as “[2]” by Kolster et al. (2009, their Figs 2, 4, 6, and 7) and designated as MTp by Kolster et al. (2010, their Fig. 1) in a reinterpretation of the same data set.
Figure 9.
Figure 9.
Comparison of macaque parietal regions from 6 studies displayed on the very inflated F99 atlas from medial (top) and dorsal (bottom) views, all with LV00 borders overlaid. (A) Cortical areas in the macaque parietooccipital cortex from the LV00 architectonic parcellations. White arrow points to the gap between area V1 and the corpus callosum. (B) FV91 areas. Arrow points to FV91 prostriate area (blue). (C) PHT00 parcellation. Arrow points to PHT00 prostriate area (PS, blue). (D) Area V6 (Galletti et al., 1999) with LV00 borders overlaid. (E) Parietal areas from Preuss and Goldman-Rakic (1991) and Lyon and Kaas (2002), with LV00 borders overlaid.
Figure 10.
Figure 10.
(A) Map of 129 areas from the composite LV-FOA-PHT parcellation shown in lateral, medial, dorsal, and ventral views. Unassigned regions (gray with asterisks, 7% of total surface area) either lacked a well-defined areal assignment in any of the 3 contributing parcellations or were assigned to a cortical area in one parcellation (e.g., V2v of PHT00) that was considered less accurate than the corresponding area of a different parcellation (e.g., V2v of LV00). (B) Histogram of areal sizes in the composite parcellation, calculated using the midthickness surface for the right hemisphere normalized to average rhesus macaque brain size (cf. Table 1).

References

    1. Bayliss GC, Rolls ET, Leonard CM. Functional subdivisions of the temporal lobe neocortex. J Neuroscience. 1987;7:330–342. - PMC - PubMed
    1. Black KJ, Koller JM, Snyder AZ, Perlmutter JS. Template images for nonhuman primate neuroimaging: 2. Macaque. Neuroimage. 2001;14:744–748. - PubMed
    1. Brodmann K. Beitraege zur histologischen Lokalisation der Grosshirnrinde: dritte Mitteilung: Die Rindenfelder der niederen Affen Journal fuer Psychologie und Neurologie. Neuroimage. 1905;4:5/6:177–226.
    1. Carmichael ST, Price JL. Architectonic subdivision of the orbital and medial prefrontal cortex in the macaque monkey. J Comp Neurol. 1994;346:366–402. - PubMed
    1. Carmichael ST, Price JL. Connectional networks within the orbital and medial prefrontal cortex of macaque monkeys. J Comp Neurol. 1996;371:179–207. - PubMed

Publication types