. 2011 Dec 2;334(6060):1278-83.
doi: 10.1126/science.1211485. Epub 2011 Nov 3.

Inhibition of pyruvate kinase M2 by reactive oxygen species contributes to cellular antioxidant responses

Affiliations

Inhibition of pyruvate kinase M2 by reactive oxygen species contributes to cellular antioxidant responses

Dimitrios Anastasiou et al. Science. .

Abstract

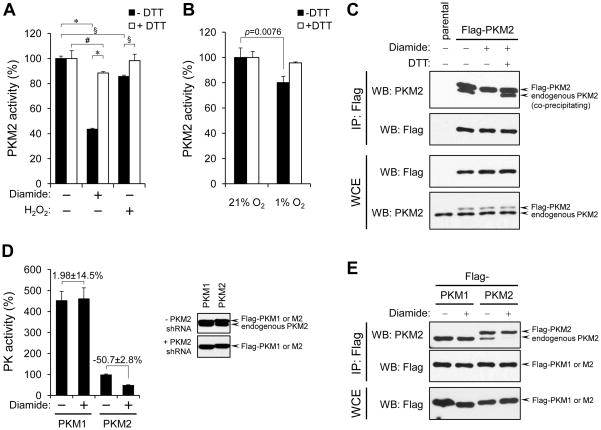
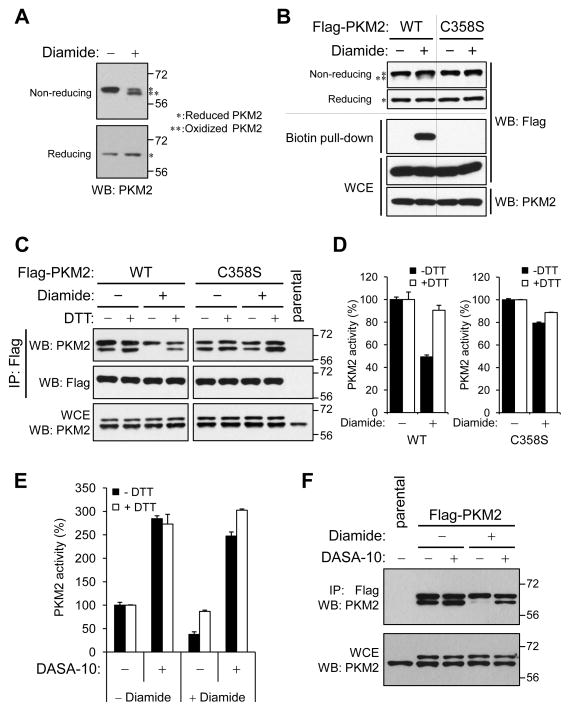
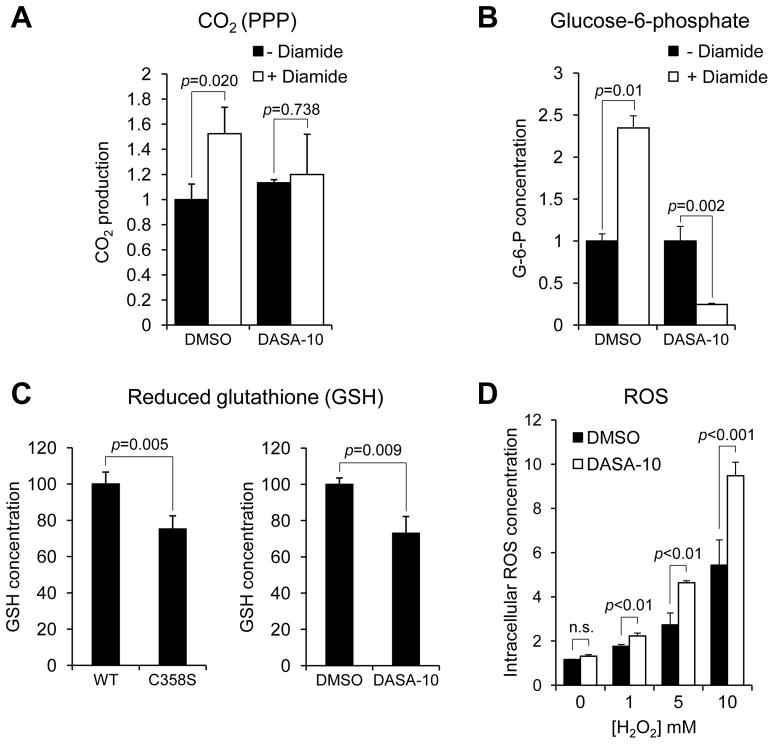
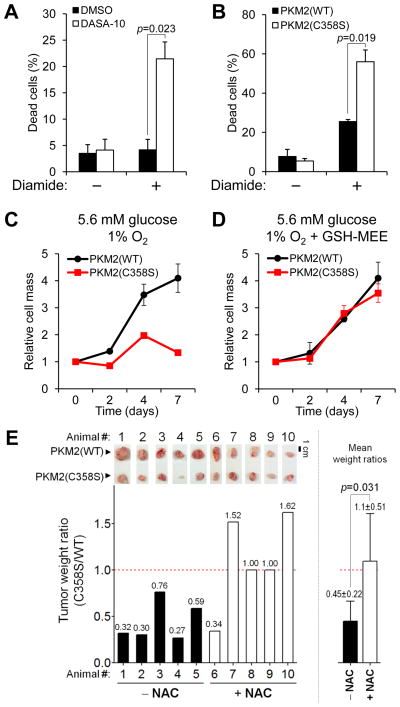
Control of intracellular reactive oxygen species (ROS) concentrations is critical for cancer cell survival. We show that, in human lung cancer cells, acute increases in intracellular concentrations of ROS caused inhibition of the glycolytic enzyme pyruvate kinase M2 (PKM2) through oxidation of Cys(358). This inhibition of PKM2 is required to divert glucose flux into the pentose phosphate pathway and thereby generate sufficient reducing potential for detoxification of ROS. Lung cancer cells in which endogenous PKM2 was replaced with the Cys(358) to Ser(358) oxidation-resistant mutant exhibited increased sensitivity to oxidative stress and impaired tumor formation in a xenograft model. Besides promoting metabolic changes required for proliferation, the regulatory properties of PKM2 may confer an additional advantage to cancer cells by allowing them to withstand oxidative stress.


Figures

Figure 1
Figure 1. ROS-promoted dissociation of PKM2 subunits and inhibition of enzymatic activity
(A) A549 human lung cancer cells were treated with 250 μM diamide or 1mM H2O2 for 15 min. After cell lysis pyruvate kinase activity was assayed in the presence or absence of DTT. % PKM2 activity (mean ± SD) relative to untreated cells for each condition is shown (: p<0.001, §: p<0.01, #: p<0.05, 2-way ANOVA with Bonferroni post-tests, N=3). (B) A549 cells were cultured in medium containing 5.6 mM glucose for 3 hours under 21% O2 or 1% O2. After cell lysis, PKM2 activity was assayed as in (A) (Student’s t-test, N=3). (C) A549 cells were engineered to express Flag-PKM2 (arrows). Cells were left untreated or were diamide-treated as in (A) and equal portions of lysates prepared under non-reducing conditions were supplemented or not with DTT (1 mM final concentration). Lysates were then subjected to immunoprecipitation with anti-Flag agarose beads in the presence or absence of DTT, followed by SDS-PAGE and western blot. (D) A549 cells expressing Flag-PKM1 or Flag-PKM2 in the absence of endogenous PKM2 (referred to in the text as Flag-PKM1/kd or Flag-PKM2/kd) were generated as in (17). Expression of Flag-tagged proteins and depletion of endogenous PKM2 were confirmed by western blot with an antibody recognizing both PKM1 and PKM2 (right panel). Left panel: lysates of diamide-treated (250 μM, 15 min.) cells were prepared and assayed for pyruvate kinase activity as in (A). % pyruvate kinase activity (mean ± SD) for each condition relative to untreated Flag-PKM2/kd cells is shown. Numbers denote % difference in PK activity ± SD between diamide-treated versus non-treated Flag-PKM1/kd or Flag-PKM2/kd cells, respectively. (E) A549 cells expressing Flag-PKM1 or Flag-PKM2 were treated with diamide (250 μM, 15 min.) and, after cell lysis, immunoprecipitation to assess the amount of endogenous PKM2 associated with the tagged PKM isoforms was performed as in (C).
Figure 2
Figure 2. Protection of PKM2 from ROS-induced inhibition by substitution of Cys358 with Ser358 or by small molecule PKM2 activators
(A) A549 cells were treated with 1mM diamide for 15 min., lysed and analyzed by SDS-PAGE under reducing (lower panel) or non-reducing (upper panel) conditions. Asterisks throughout the figure mark bands corresponding to reduced PKM2 (*) or oxidized (**) PKM2. (B) Upper panel: A549 cells expressing Flag-PKM2 or Flag-PKM2(C358S) were treated with 250 μM diamide for 15 minutes, lysed, and analyzed by SDS-PAGE under reducing or non-reducing conditions. Lower panel: A549 Flag-PKM2/kd or Flag-PKM2(C358S)/kd cells were treated with diamide as above. Oxidized proteins were labeled with biotin-maleimide (24), purified with streptavidin-sepharose beads and probed for the presence of Flag-PKM2 or Flag-PKM2(C358S) with Flag antibody. (C) A549 cells expressing Flag-PKM2 or Flag-PKM2(C358S), were treated with 250 μM diamide for 15 min., lysed without DTT and split into equal portions that were supplemented with or without DTT (1 mM final concentration). After immunoprecipitation with anti-Flag agarose, immunoprecipitates were analyzed by reducing SDS-PAGE and western blot with the indicated antibodies. (D) A549 Flag-PKM2/kd or Flag-PKM2(C358S)/kd cells were treated with diamide as in (C) and pyruvate kinase activity was assayed in cell lysates in the presence or absence of 1 mM DTT. % PKM2 activity (mean ± SD) relative to untreated cells for each condition is shown. (E) Medium containing 20 μM PKM2 activator DASA-10 (28) was added to A549 cells at t=−1h; diamide was then added directly to the media at a final concentration of 250 μM at t=−15 min. Cells were harvested at t=0, lysed, and pyruvate kinase activity in lysates was assayed in the presence or absence of 1 mM DTT. PKM2 activity is shown as in (D). (F) A549 cells expressing Flag-PKM2 were treated with DASA-10 and diamide as in (E) and the respective lysates were subjected to immunoprecipitation with anti-Flag agarose under non-reducing conditions. Immunoprecipitates were analyzed by reducing SDS-PAGE followed by western blot with a PKM2 antibody.
Figure 3
Figure 3. Changes in glucose metabolism required for cellular antioxidant responses are supported by ROS-induced inhibition of PKM2
(A) PPP-dependent glucose oxidation to CO2. A549 cells were seeded and, after 24 hours, media were supplemented with [1-14C]-glucose or [6-14C]-glucose plus 10 μM DASA-10 and 100 μM diamide where indicated. Released 14CO2 was measured after a 3-hour incubation of cells with labeled glucose. The rate of 14CO2 production from glucose via the PPP was calculated as described (24). Mean PPP-dependent 14CO2 release rates relative to (DMSO, - Diamide) ± SD are shown (Student’s t-test, N=3). (B) A549 cells were treated with 10 μM PKM2 activator DASA-10 or DMSO for 1 hour prior to addition of 250 μM diamide directly into the medium. Cellular metabolites were harvested at t=30 min. and analyzed by liquid chromatography coupled to triple quadrupole tandem mass spectrometry (LC-MS/MS) (24). Bars represent mean concentrations of glucose-6-phosphate at t=30 min. relative to t=0 min. ± SD (N=3). Statistical analysis details are described in (24). (C) Intracellular GSH concentrations of A549 Flag-PKM2/kd and Flag-PKM2(C358S)/kd cells (left panel) or A549 cells treated either with PKM2 activator DASA-10 (10 μM) or DMSO for 1 hour (right panel) were assessed using ThiolTracker Violet. Mean GSH concentrations relative to WT or DMSO-treated cells, respectively, are shown (Student’s t-test, N=3). (D) After treatment with DMSO or 10 μM PKM2 activator DASA-10 for 1 h, A549 cells were incubated with the ROS-sensitive fluorescent dye CM-H2DCFDA and H2O2 was added at the indicated concentrations. Cells were then collected after 15 minutes and ROS-dependent fluorescence was measured by flow cytometry. Mean fluorescence intensities ± SD are shown and p values were calculated by 2-way ANOVA with Bonferroni post-tests (N=3).
Figure 4
Figure 4. Promotion of cancer cell survival and tumor growth under oxidative stress by PKM2 inhibition
(A) DASA-10 (10 μM) or DMSO was added to H1299 human lung cancer cells at t=−1h. At t=0, 150 μM diamide was added directly into the medium. At t=+3h, cells were collected by trypsinization and stained with propidium iodide (PI). Dead (PI-stained) cells were scored by flow cytometry (Student’s t-test, N=3). (B) H1299 Flag-PKM2/kd or H1299 Flag-PKM2(C358S)/kd cells were treated with 150 μM diamide for 3 hours, at which point dead cells were detected as in (A) (Student’s t-test, N=3). (C and D) H1299 Flag-PKM2/kd or H1299 Flag-PKM2(C358S)/kd cells were seeded in medium containing 5.6 mM glucose and cultured in 1% oxygen (O2) in the absence (C) or presence (D) of 4 mM glutathione monoethyl ester (GSH-MEE). Cells were fixed at the indicated time points and cell mass was quantified by crystal violet staining (C: p<0.0001, 2-way ANOVA, N=3) (24). (E) Equal numbers of H1299 Flag-PKM2/kd or Flag-PKM2(C358)/kd cells were injected into the left and right flanks, respectively, of immunocompromised mice. Half had access to normal water and the other half to water supplemented with 40 mM NAC throughout the experiment. Upper panel: photographs of dissected tumors in pairs. The bar graphs represent tumor weight ratios with corresponding value above each bar (left) and mean weight ratios ± SD (right) (p value calculated by Student’s t-test).

Comment in

References

    1. Tonks NK. Cell. 2005;121:667. - PubMed
    1. Wellen KE, Thompson CB. Mol Cell. 2010;40:323. - PMC - PubMed
    1. Vafa O, et al. Mol Cell. 2002;9:1031. - PubMed
    1. Nogueira V, et al. Cancer Cell. 2008;14:458. - PMC - PubMed
    1. Sablina AA, et al. Nat Med. 2005;11:1306. - PMC - PubMed

Publication types

MeSH terms