. 2012 Feb;40(4):1695-707.
doi: 10.1093/nar/gkr934. Epub 2011 Nov 3.

Upregulation of Cyclin B1 by miRNA and its implications in cancer

Affiliations

Upregulation of Cyclin B1 by miRNA and its implications in cancer

Vera Huang et al. Nucleic Acids Res. 2012 Feb.

Abstract

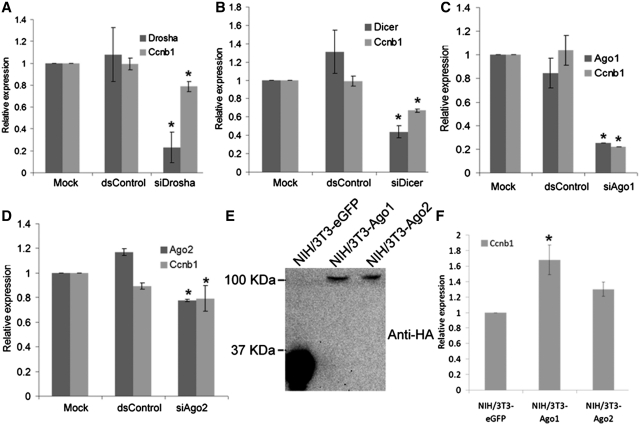
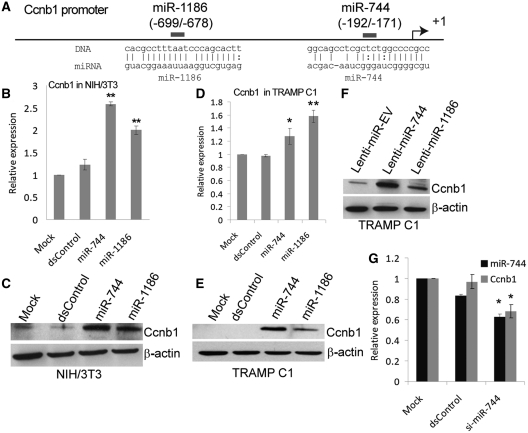
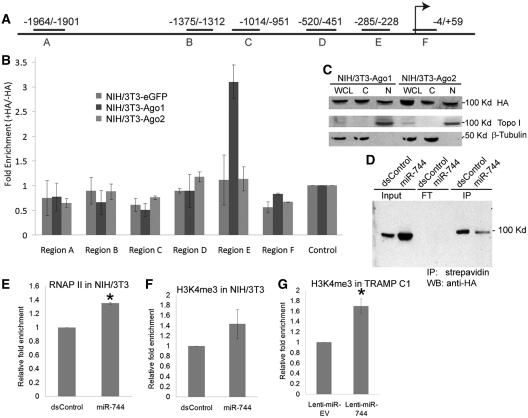
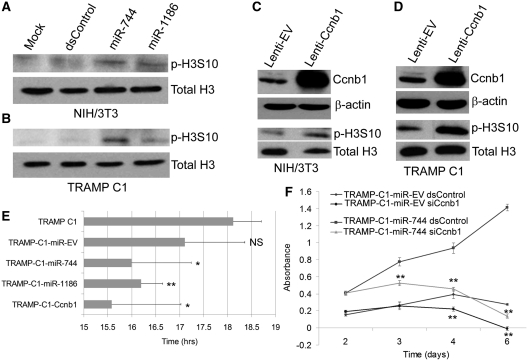
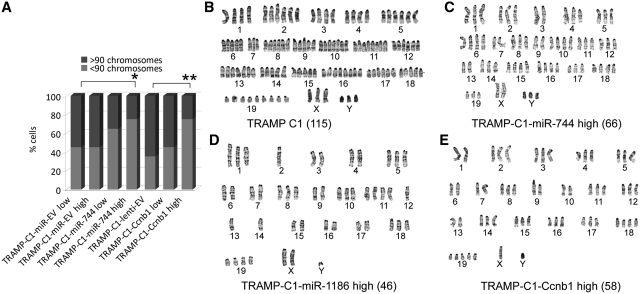
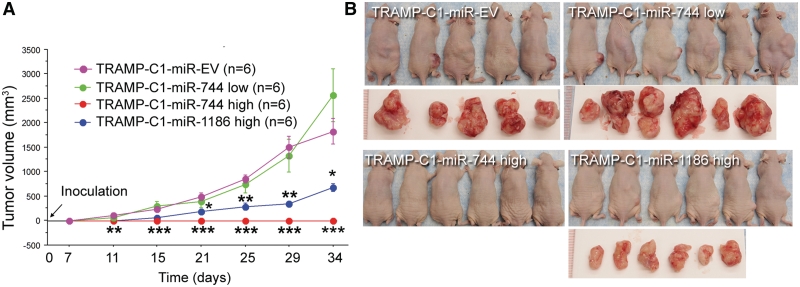
It is largely recognized that microRNAs (miRNAs) function to silence gene expression by targeting 3'UTR regions. However, miRNAs have also been implicated to positively-regulate gene expression by targeting promoter elements, a phenomenon known as RNA activation (RNAa). In the present study, we show that expression of mouse Cyclin B1 (Ccnb1) is dependent on key factors involved in miRNA biogenesis and function (i.e. Dicer, Drosha, Ago1 and Ago2). In silico analysis identifies highly-complementary sites for 21 miRNAs in the Ccnb1 promoter. Experimental validation identified three miRNAs (miR-744, miR-1186 and miR-466d-3p) that induce Ccnb1 expression in mouse cell lines. Conversely, knockdown of endogenous miR-744 led to decreased Ccnb1 levels. Chromatin immunoprecipitation (ChIP) analysis revealed that Ago1 was selectively associated with the Ccnb1 promoter and miR-744 increased enrichment of RNA polymerase II (RNAP II) and trimethylation of histone 3 at lysine 4 (H3K4me3) at the Ccnb1 transcription start site. Functionally, short-term overexpression of miR-744 and miR-1186 resulted in enhanced cell proliferation, while prolonged expression caused chromosomal instability and in vivo tumor suppression. Such phenotypes were recapitulated by overexpression of Ccnb1. Our findings reveal an endogenous system by which miRNA functions to activate Ccnb1 expression in mouse cells and manipulate in vivo tumor development/growth.


Figures

Figure 1.
Figure 1.
Ccnb1 expression depends on components of the miRNA pathway. (A–D) NIH/3T3 cells were transfected at 50 nM with the indicated siRNAs for 72 h. dsControl served as non-specific control duplex. Mock samples were transfected in the absence of siRNA. Relative expression levels were quantified by real-time PCR using gene-specific primer sets. Values were normalized to β-actin. (E) Establishment of NIH/3T3-Ago1 and NIH/3T3-Ago2 cell lines. Expression of HA-tagged Ago1 and Ago2 was confirmed by immunoblot analysis using an antibody specific to the HA epitope (anti-HA). NIH/3T3-eGFP cells served as a control cell line. (F) Expression levels of Ccnb1 were determined by real-time PCR in NIH/3T3-Ago1 and NIH/3T3-Ago2 cell lines relative to NIH/3T3-eGFP cells. Values were normalized to β-actin. All data represents mean ± SE of three independent experiments; *P < 0.05.
Figure 2.
Figure 2.
miRNAs targeting the Ccnb1 promoter induce Ccnb1 expression. (A) Schematic representation of the Ccnb1 promoter and miRNA target locations relative to the TSS. (B and D) NIH/3T3 or TRAMP C1 cells were transfected with 100 nM miRNA control (dsControl), miR-744, or miR-1186 for 5 days. Mock samples were transfected in the absence of miRNA. Ccnb1 mRNA levels were analyzed by real-time RT–PCR and normalized to β-actin levels. (C and E) NIH/3T3 or TRAMP C1 cells were transfected as in (B and D). Proteins levels of Ccnb1 and β-actin were evaluated by immunoblot analysis. Detection of β-actin served as a loading control. (F) Ccnb1 and β-actin protein levels were determined by immunoblot analysis in stable TRAMP C1 cells infected with either lenti-miR-744 or lenti-miR-1186 virus particles. Cells stably expressing the empty vector (Lenti-miR-EV) were established as a control. (G) NIH/3T3 cells were transfected with 100 nM dsControl or si-miR-744 for 72 h. miR-744 levels were evaluated by real-time RT–PCR and standardized to U6 levels, while Ccnb1 expression was normalized to β-actin. All data represents mean ± SE of three independent experiments; *P < 0.05, **P < 0.005.
Figure 3.
Figure 3.
Ago1 associates with the proximal promoter of mouse Ccnb1. (A) Schematic illustration of the primer amplicons (Regions A–F) used for scanning ChIP analysis of 2 kb of the proximal Ccnb1 promoter. Locations are shown relative to the TSS. (B) ChIP experiments were performed with an anti-HA antibody in NIH/3T3-Ago1, NIH/3T3-Ago2 and NIH/3T3-eGFP cells to examine Ago1/2 enrichment within the Ccnb1 promoter. Real-time PCR was utilized to quantify fold enrichment of Ago1 and/or Ago2 at designated primer regions relative to no antibody controls. Data was normalized to an intergenic region (Control) devoid of Ago binding. (C) Subcellular localization of Ago1 and Ago2. Whole-cell lysate (WCL), nuclear (N) and cytoplasmic (C) extracts were analyzed by immunoblot analysis in NIH/3T3-Ago1 and NIH/3T3-Ago2 cell lines. HA-tagged Ago1 and Ago2 were detected using an anti-HA antibody. Topoisomerase I (Topo I) and β-tubulin served as nuclear and cytoplasmic markers, respectively. (D) Biotinylated miR-744 associates with Ago1. NIH/3T3-Ago1 cells were transfected with biotinylated dsControl or miR-744 at 100 nM for 3 days. Immunoprecipitation (IP) was performed with streptavidin Dynabeads followed by immunoblotting (IB) with an anti-HA antibody to detect HA-tagged Ago1. FT: flowthrough, Input: 10% input chromatin. (E and F) Enrichment of RNAP II and H3K4me3 at the Ccnb1 promoter. NIH/3T3 cells were transfected with 100 nM dsControl or miR-744 for 72 h. ChIP–qPCR was utilized to quantify enrichment of RNAP II and H3K4me3 at the Ccnb1 TSS (Region F). Fold changes are relative to dsControl treatments and normalized to amplification values in IgG control samples. (G) ChIP–qPCR analysis of H3K4me3 at the Ccnb1 TSS in TRAMP C1 sublines expressing either lenti-miR-EV or lenti-miR-744. Relative enrichment was calculated as in (E and F). Error bars represent mean ± SE of two independent experiments; *P < 0.05.
Figure 4.
Figure 4.
miR-744 and miR-1186 promote phosphorylation of histone H3 and enhance in vitro cell proliferation. (A and B) NIH/3T3 and TRAMP C1 cells were transfected with 100 nM dsControl, miR-744 or miR-1186 for 5 days. Mock samples were transfected in the absence of miRNA. Total H3 and phosphorylated H3S10 (p-H3S10) levels were examined by immunoblot analysis using specific antibodies. (C and D) Total H3 and p-H3S10 levels were immunodetected in stable NIH/3T3 and TRAMP C1 sublines infected with either lenti-Ccnb1 or lenti-EV viral particles. (E) The doubling time of TRAMP C1 cells expressing empty vector (TRAMP-C1-miR-EV), miR-744 (TRAMP-C1-miR-744), miR-1186 (TRAMP-C1-miR-1186), or Ccnb1 (TRAMP-C1-Ccnb1) was evaluated over the course of 5 days. The average doubling time (hrs) ± SE of independent experiments is plotted in the corresponding bar graph; *P < 0.05, **P < 0.01, NS: not significant compared to the TRAMP C1 parental cell line. (F) TRAMP-C1-miR-EV or TRAMP-C1-miR-744 cells were transfected with 50 nM dsControl or siCcnb1. Cell proliferation was quantified at each day utilizing the CellTiter96 Aqueous One Solution. Error bars represents SE from four independent transfections. Statistical significance was determined between dsControl and siCcnb1 treatments within each subline; *P < 0.05, **P < 0.01.
Figure 5.
Figure 5.
miR-744, miR-1186 and Ccnb1 induce conserved cytogenetic changes in TRAMP C1 cells. (A) Twenty randomly selected cells from the parental TRAMP C1 or indicated derived sublines were subjected to G-banded karyotyping. Percent cell population (% cells) with chromosome numbers >90 or <90 are indicated in the bar graph; *P < 0.05, **P < 0.001. (B–E) Representative chromosome spreads from parental TRAMP C1 (B), TRAMP-C1-miR-744 high (C), TRAMP-C1-miR-1186 high (D), or TRAMP-C1-Ccnb1 high (E) cells. Denoted in parentheses is the total number of chromosomes found in corresponding spread.
Figure 6.
Figure 6.
Prolonged overexpression of miR-744 or miR-1186 alters in vivo tumor growth. (A) Cells (2 × 106) from the indicated stable TRAMP C1 sublines were injected into the right lower flank of male athymic mice and monitored for 35 days. Subcutaneous tumor dimensions were recorded using calipers at the indicated time points (days) following initial inoculation. Tumor volume was calculated according to the formula (width × width × length)/2. Data is plotted as the mean volume ± SE; *P < 0.05; **P < 0.01; ***P < 0.001. (B) Photographs of inoculated mice and corresponding resected tumors from each group at time of sacrifice on Day 35.

References

    1. Czech B, Hannon GJ. Small RNA sorting: matchmaking for Argonautes. Nat. Rev. Genet. 2011;12:19–31. - PMC - PubMed
    1. Bartel DP. MicroRNAs: genomics, biogenesis, mechanism, and function. Cell. 2004;116:281–297. - PubMed
    1. Ambros V. microRNAs: tiny regulators with great potential. Cell. 2001;107:823–826. - PubMed
    1. Lytle JR, Yario TA, Steitz JA. Target mRNAs are repressed as efficiently by microRNA-binding sites in the 5′ UTR as in the 3′ UTR. Proc. Natl Acad. Sci. USA. 2007;104:9667–9672. - PMC - PubMed
    1. Lee I, Ajay SS, Yook JI, Kim HS, Hong SH, Kim NH, Dhanasekaran SM, Chinnaiyan AM, Athey BD. New class of microRNA targets containing simultaneous 5′-UTR and 3′-UTR interaction sites. Genome Res. 2009;19:1175–1183. - PMC - PubMed

Publication types