. 2011;13(6):R111.
doi: 10.1186/bcr3053. Epub 2011 Nov 4.

Loss of interferon regulatory factor 5 (IRF5) expression in human ductal carcinoma correlates with disease stage and contributes to metastasis

Affiliations

Loss of interferon regulatory factor 5 (IRF5) expression in human ductal carcinoma correlates with disease stage and contributes to metastasis

Xiaohui Bi et al. Breast Cancer Res. 2011.

Abstract

Introduction: New signaling pathways of the interleukin (IL) family, interferons (IFN) and interferon regulatory factors (IRF) have recently been found within tumor microenvironments and in metastatic sites. Some of these cytokines stimulate while others inhibit breast cancer proliferation and/or invasion. IRFs, a family of nine mammalian transcription factors, have multiple biologic functions that when dysregulated may contribute to tumorigenesis; most well-known are their roles in regulating/initiating host immunity. Some IRF family members have been implicated in tumorigenesis yet little is still known of their expression in primary human tumors or their role(s) in disease development/progression. IRF5 is one of the newer family members to be studied and has been shown to be a critical mediator of host immunity and the cellular response to DNA damage. Here, we examined the expression of IRF5 in primary breast tissue and determined how loss of expression may contribute to breast cancer development and/or progression.

Methods: Formalin-fixed paraffin-embedded archival breast tissue specimens from patients with atypical ductal hyperplasia (ADH), ductal carcinoma in situ (DCIS) and invasive ductal carcinoma (IDC) were examined for their expression of IRF1 and IRF5. Knockdown or overexpression of IRF5 in MCF-10A, MCF-7 and MDA-MB-231 mammary epithelial cell lines was used to examine the role of IRF5 in growth inhibition, invasion and tumorigenesis.

Results: Analysis of IRF expression in human breast tissues revealed the unique down-regulation of IRF5 in patients with different grades of DCIS and IDC as compared to IRF1; loss of IRF5 preceded that of IRF1 and correlated with increased invasiveness. Overexpression of IRF5 in breast cancer cells inhibited in vitro and in vivo cell growth and sensitized them to DNA damage. Complementary experiments with IRF5 siRNAs made normal mammary epithelial cells resistant to DNA damage. By 3-D culture, IRF5 overexpression reverted MDA-MB-231 to normal acini-like structures; cells overexpressing IRF5 had decreased CXCR4 expression and were insensitive to SDF-1/CXCL12-induced migration. These findings were confirmed by CXCR4 promoter reporter assays.

Conclusions: IRF5 is an important tumor suppressor that regulates multiple cellular processes involved in the conversion of normal mammary epithelial cells to tumor epithelial cells with metastatic potential.


Figures

Figure 1
Figure 1
Dysregulated IRF expression in patients with ductal carcinoma. A. Normal and ADH breast tissue specimens were stained by IF or IHC. Antibodies recognizing IRF5 (FITC), IRF1 (Cy3) and DAPI for the nucleus were used for IF. For IHC, tissues were stained for IRF1 with DAB (brownish-red), IRF5 with BAP (blue), and nucleus with Fast Red mounting buffer. B. Same as in (A), except tissue samples from patients with ADH were stained by IF with IRF5 (FITC) and CK14 (Cy3) in order to confirm expression of IRF5 in myoepithelial cells. C. Same as in (A), except tissues from patients with DCIS and IDC were examined. Representative pictures of low grade and high grade DCIS are shown illustrating distinct differences between IRF1 and IRF5 expression. Images were taken on a Zeiss Axiovert Apotome microscope at 20 × or 40 × magnification. Scale bars are 50 μm.
Figure 2
Figure 2
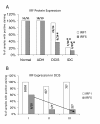
Summary of IRF expression in breast tissue specimens. A. Percent of samples with positive staining is shown on y-axis, tissue and disease type are shown on x-axis. Number of samples positive for IRF1 or IRF5 is shown over total number of patient samples examined in each group. Statistical significance was determined by comparing the number of positive-stained samples in each disease type to positive-stained samples in normal tissues; * denotes P < 0.05, **P < 0.001. B. Same as in A, except expression in different stages of DCIS is shown.
Figure 3
Figure 3
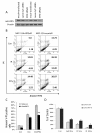
Overexpression of IRF5 in MCF-7 and MDA-MB-231 cells sensitizes them to DNA damage-induced growth inhibition. A. Endogenous IRF expression was analyzed by Western blot in transformed mammary epithelial cell lines. Levels of β-actin are shown as loading controls. B. Western blot analysis of stable cell lines generated to overexpress retroviral pBIRF5. C. Cell survival was measured in MCF-7 and MDA-MB-231 pBabe cell lines by colony formation assay before and after treatment. Cells were treated with 0.1 or 1 μM Doxorubicin (Dox) or 2, 5 and 10 Gy γ-IR. The number of colonies is plotted on the y-axis as percent of control; 100% represents the number of colonies in empty pBabe control lines. Data are expressed as mean ± SD of three independent experiments performed in duplicate. Statistical significance was determined by comparing the difference between colonies in pBabe versus pBIRF5 cell lines after each treatment; * denotes P < 0.05, ** P < 0.001.
Figure 4
Figure 4
Overexpression of IRF5 in MDA-MB-231 cells sensitizes them to IR-induced apoptosis. A. MDA-MB-231 cells were exposed to 5 Gy IR or the same dose plus IFN-γ (IR/γ) for 24 h. Percent of cells undergoing apoptosis was measured by FACS analysis of Annexin V-FITC (x-axis) and PI (y-axis) double-staining. Percent of Annexin V-FITC stained positive cells is shown in the upper and lower right-hand quadrants. Representative histogram plots from three independent experiments performed in duplicate are shown. B. Same as in (A), except cells were treated with 1 μM Dox or the same dose plus IFN-γ (Dox/γ) for five hours. Percent of Annexin V-FITC-stained positive cells compared to control is plotted on y-axis. Data are expressed as mean ± SD of three independent experiments performed in duplicate. Statistical significance was determined by comparing the difference between pBabe and pBIRF5 cells lines after each treatment; ** denotes P < 0.001. C. Same as in (B), except MCF-7 cells were treated with Dox.
Figure 5
Figure 5
Down-regulation of IRF5 protein expression by siRNAs alters sensitivity to DNA damage. A. MCF-12A cells were incubated with transfection reagent alone (mock-transfected), control Lamin A/C siRNAs or 5 nM IRF5 siRNAs once (IRF5 siRNA1) or twice (IRF5 siRNA2), as described in the Materials and methods. Western blot analysis shows > 70% reduction of endogenous IRF5 proteins after normalization to β-actin levels. B. Cells were exposed to 5 Gy IR or the same dose plus IFN-γ (IR/γ) for 24 h. Percent of Annexin V-FITC stained positive cells is shown in the upper and lower right-hand quadrants. Representative histogram plots from three independent experiments performed in duplicate are shown. C. Same as in B, except cells were exposed to 1 μM Dox or Dox and IFN-γ for five hours. Percent of Annexin V-FITC stained positive cells compared to control is plotted on y-axis. Data are expressed as mean ± SD of three independent experiments performed in duplicate. Statistical significance was determined by comparing the difference between cells transfected with Lamin A/C siRNAs (12Asicon) and IRF5 siRNAs (12AsiIRF5) after each treatment; ** denotes P < 0.001. D. Cells were treated with the indicated doses of Dox or IR after siRNA transfection. Number of colonies is plotted on y-axis as percent of control. A total of 100% represents the number of colonies in control untreated 12Asicon cells. Data are expressed as mean ± SD of three independent experiments performed in duplicate. Statistical significance was determined by comparing the difference between colonies in 12Asicon versus 12AsiIRF5 cells after each treatment; * denotes P < 0.05.
Figure 6
Figure 6
IRF5 inhibits in vivo tumor formation and in vitro metastasis/invasion. A. MCF-7/pBIRF5 (MCF7-IRF5) and MCF-7/pBabe (MCF7-EV) control cells were inoculated into NCr nu/nu mice. The number of mice with tumors over the total number of mice is shown. B. Same as in (A), except 3 × 10⁶ MDA-MB-231 control cells (231-EV) or MDA-MB-231 IRF5 overexpressing cells (231-IRF5) were inoculated into NCr nu/nu mice and monitored over seven weeks. C. Growth of MCF-7 and MDA-MB-231 cells were examined by 3-D culture. An equal number of cells were plated and pictures taken 10 days later at 10 × magnification.
Figure 7
Figure 7
IRF5 reduces CXCR4 cell surface expression and SDF-1/CXCL12-dependent chemotaxis of MDA-MB-231 cells. A. CXCR4 expression (grey line) in unstimulated cells, shown superimposed on the isotype control (grey shaded area), and CXCR4 expression (black line) after stimulation, was measured by flow cytometry. MDA-MB-231 cells (pBabe and pBIRF5) were treated with the CXCR4 ligand SDF-1 for six hours and CXCR4 expression measured. IRF5 expressing cells show no significant expression of CXCR4. M1, Marker 1. Representative histogram plots from three independent experiments performed in duplicate are shown. B. Cells overexpressing IRF5 are incapable of SDF-1-induced migration when compared to empty vector (EV pBabe) control cells. Data are expressed as mean ± SD of three independent experiments performed in duplicate. Statistical significance was determined by comparing the difference in number of cells migrated between pBabe and pBIRF5 cells; * denotes P <0.02, **P <0.005. C. CXCR4 promoter reporter activity was analyzed by Dual Luciferase assay. MDA-231-pBabe and MDA-231-pBIRF5 were transfected with pGL3 empty vector or pGL3CXCR45'Δ3 promoter and mock-treated with PBS or 100 ng/ml CXCL12. Data are expressed as the mean relative stimulation ± SD from three independent experiments performed in triplicate. Statistical significance was determined by comparing the difference in promoter activity between pBabe and pBIRF5 expressing cells; * denotes P < 0.05.

References

    1. Beckmann MW, Niederacher D, Schnurch HG, Gusterson BA, Bender HG. Multistep carcinogenesis of breast cancer and tumour heterogeneity. J Mol Med. 1997;75:429–439. doi: 10.1007/s001090050128. - DOI - PubMed
    1. Nicolini A, Carpi A, Rossi G. Cytokines in breast cancer. Cytokine Growth Factor Rev. 2006;17:325–337. doi: 10.1016/j.cytogfr.2006.07.002. - DOI - PubMed
    1. Barnes BJ, Moore PA, Pitha PM. Virus-specific activation of a novel interferon regulatory factor, IRF-5, results in the induction of distinct interferon α genes. J Biol Chem. 2001;276:23382–23390. doi: 10.1074/jbc.M101216200. - DOI - PubMed
    1. Barnes BJ, Kellum MJ, Field AE, Pitha PM. Multiple regulatory domains of irf-5 control activation, cellular localization, and induction of chemokines that mediate recruitment of T lymphocytes. Mol Cell Biol. 2002;22:5721–5740. doi: 10.1128/MCB.22.16.5721-5740.2002. - DOI - PMC - PubMed
    1. Schoenemeyer A, Barnes BJ, Mancl ME, Latz E, Goutagny N, Pitha PM, Fitzgerald KA, Golenbock DT. The interferon regulatory factor, IRF-5, is a central mediator of Toll-like receptor 7 signaling. J Biol Chem. 2005;280:17005–17012. doi: 10.1074/jbc.M412584200. - DOI - PubMed

Publication types

MeSH terms