

Review
doi: 10.1016/j.ccm.2011.09.001.
Lung cancer: epidemiology, etiology, and prevention
Affiliations
- PMID: 22054876
- PMCID: PMC3864624
- DOI: 10.1016/j.ccm.2011.09.001
Item in Clipboard
Review
Lung cancer: epidemiology, etiology, and prevention
Clin Chest Med.
2011 Dec.
Abstract
Lung cancer is the leading cause of cancer death in the United States and around the world. A vast majority of lung cancer deaths are attributable to cigarette smoking, and curbing the rates of cigarette smoking is imperative. Understanding the epidemiology and causal factors of lung cancer can provide additional foundation for disease prevention. This article focuses on modifiable risk factors, including tobacco smoking, occupational carcinogens, diet, and ionizing radiation. It also discusses briefly the molecular and genetic aspects of lung carcinogenesis.
Copyright © 2011 Elsevier Inc. All rights reserved.
Figures
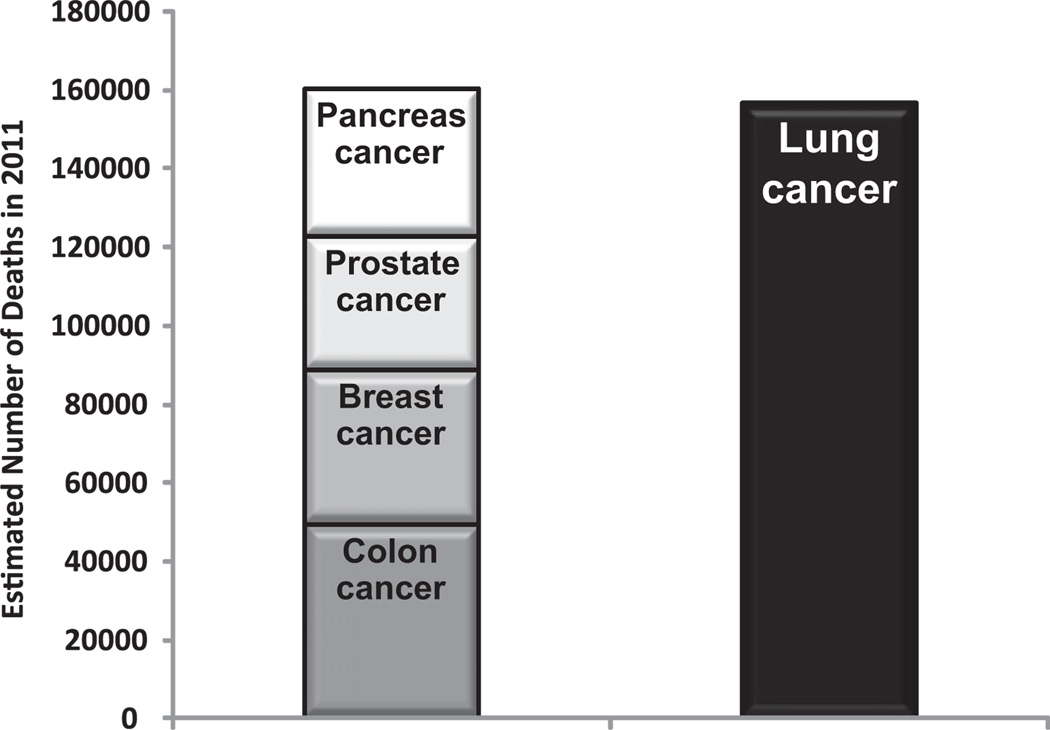
Estimated deaths from lung cancer compared with colon cancer, breast cancer, prostate cancer, and pancreatic cancer combined. (Data from Siegel R, Ward E, Brawley O, et al. Cancer statistics, 2011: the impact of eliminating socioeconomic and racial disparities on premature cancer deaths. CA Cancer J Clin 2011;61(4):212–36.)
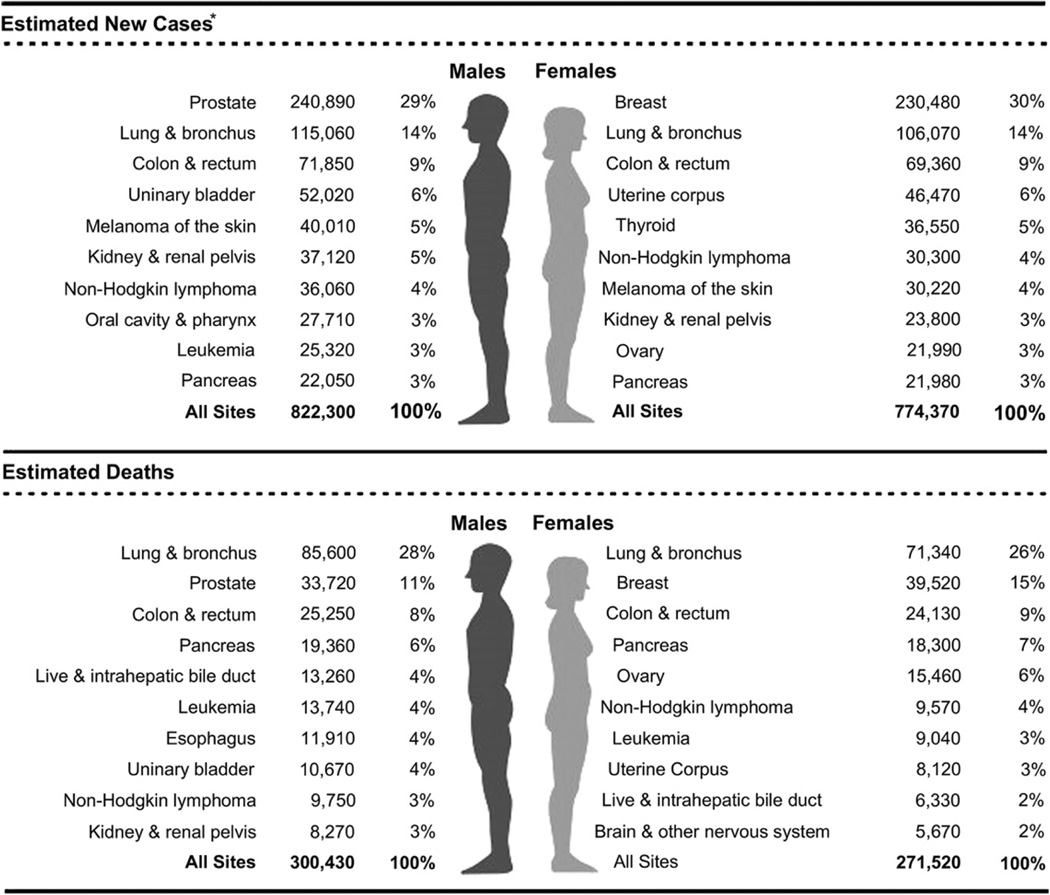
Ten leading cancer types for the estimated new cancer cases and deaths categorized by gender. (From Siegel R, Ward E, Brawley O, et al. Cancer statistics, 2011: the impact of eliminating socioeconomic and racial disparities on premature cancer deaths. CA Cancer J Clin 2011;61(4):212–36; with permission.)
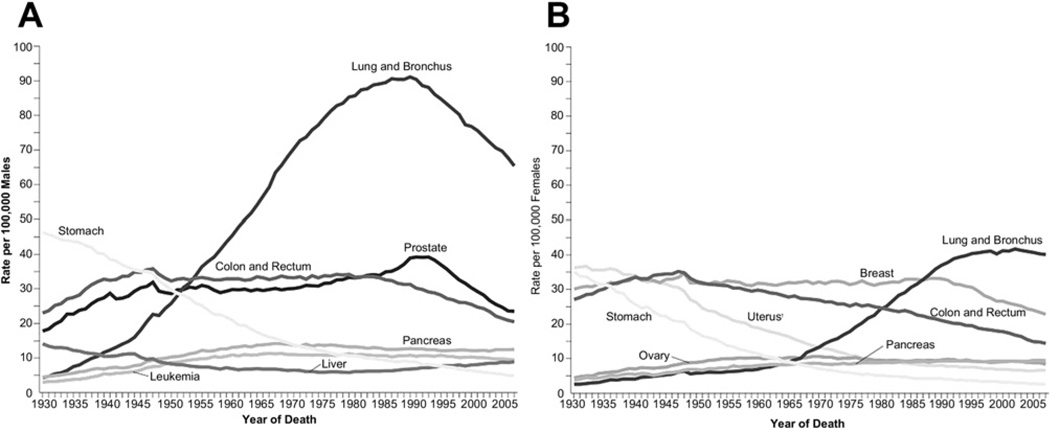
Annual age-adjusted cancer death rates among (A) men and (B) women for selected cancers. Rates are age adjusted to the 2000 US standard population. Due to changes in International Classification of Diseases coding, numerator information has changed over time. Rates for cancers of the uterus, ovary, lung and bronchus, and colon and rectum are affected by these changes. (Source: US Mortality Volumes 1930 to 1959, US Mortality Data, 1960 to 2007. National Center for Health Statistics, Centers for Disease Control and Prevention; 2006.) (From Siegel R, Ward E, Brawley O, et al. Cancer statistics, 2011: the impact of eliminating socioeconomic and racial disparities on premature cancer deaths. CA Cancer J Clin 2011;61(4):212–36; with permission.)
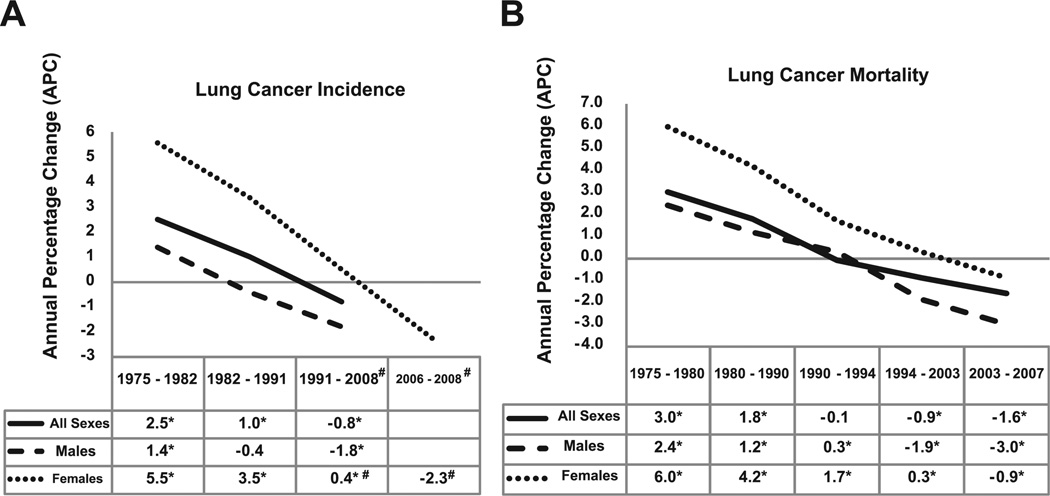
Trends in (A) lung cancer incidence and (B) lung cancer mortality rates in the United States as evaluated by the annual percentage change (APC). A negative APC value means that the trend is a decrease; a positive APC value refers to an increase trend. Asterisk refers to statistically significant APC value; # refers to the APC value of 0.5 for women for the period 1991–2006; and the APC trend value of −2.3 refers to the period 2006–2008. (Data from Howlander N, Noone A, Krapcho M, et al. Cancer of the lung and bronchus [invasive]. In: Institute NC, editor. SEER Cancer Statistics Review 1975–2008; 2011.)
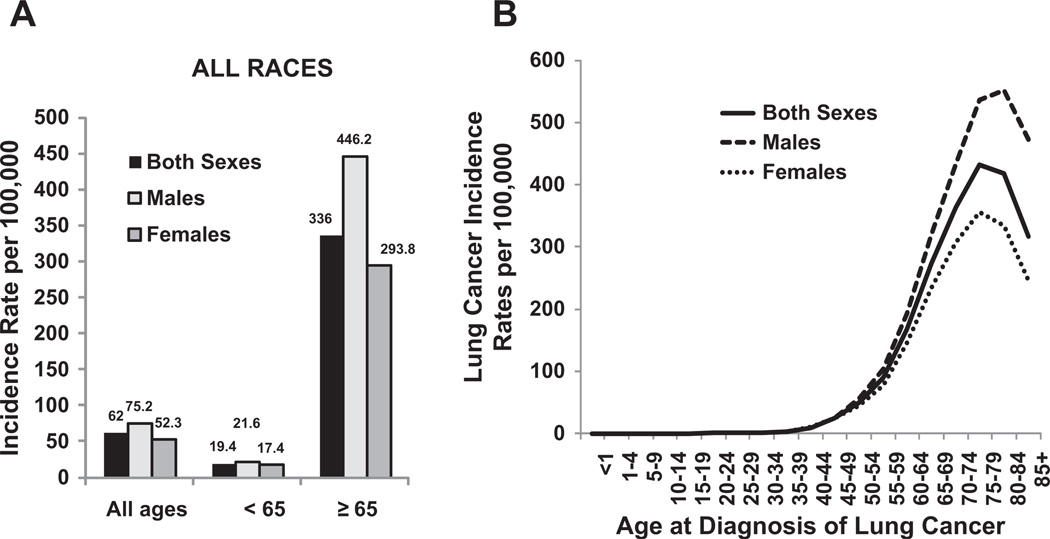
US age-adjusted lung cancer incidence by gender, age, and race. (A) Separated by age <65 years and age ≥65 years. (B) Separated by age from <1 to 851 years. Rates are per 100,000 and are age-adjusted to the 2000 US standard population. (Data from Howlader N, Noone AM, Krapcho M, et al, editors. SEER Cancer Statistics Review, 1975–2008. Bethesda (MD): National Cancer Institute; 2010. Available at: http://seer.cancer.gov/csr/1975_2008/ , based on November 2010 SEER data submission, posted to the SEER web site, 2011.)
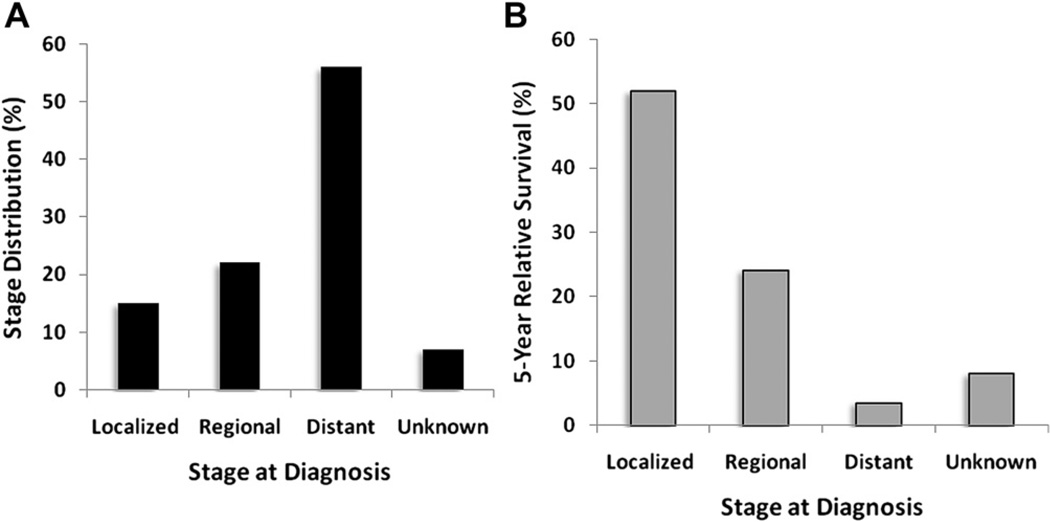
Stage distribution and 5-year relative survival by stage at time of diagnosis for 2001 to 2007. (A) Stage distribution and (B) 5-year relative survival based on stage at diagnosis of lung cancer. Localized disease defined by confinement to primary site. Regional refers to spread to regional lymph nodes. Distant refers to when cancer has metastasized. Unknown includes unstaged cancers. Stage distribution is based on summary stage 2000 documentations. (Data from Howlader N, Noone AM, Krapcho M, et al, editors. SEER Cancer Statistics Review, 1975– 2008. Bethesda (MD): National Cancer Institute; 2010. Available at: http://seer.cancer.gov/csr/1975_2008/ , based on November 2010 SEER data submission, posted to the SEER web site, 2011.)
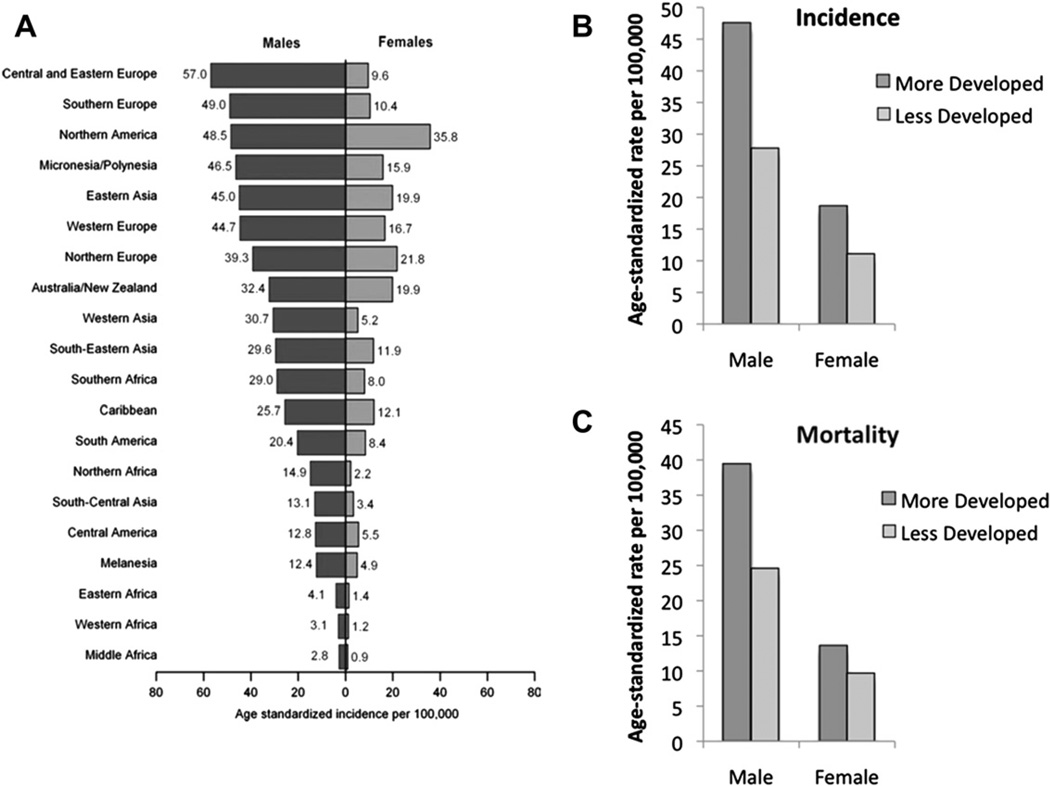
Age-standardized lung cancer incidence and mortality rates by gender and world area. Lung cancer incidence by gender and world area (A). Incidence (B) and mortality rates (C) of lung cancer by gender for more developed and less developed areas in the world, 2008. Rates are standardized to the world standard population. (Adapted from Jemal A, Bray F, Center MM, et al. Global cancer statistics. CA Cancer J Clin 2011;61(2):69–90; with permission.)
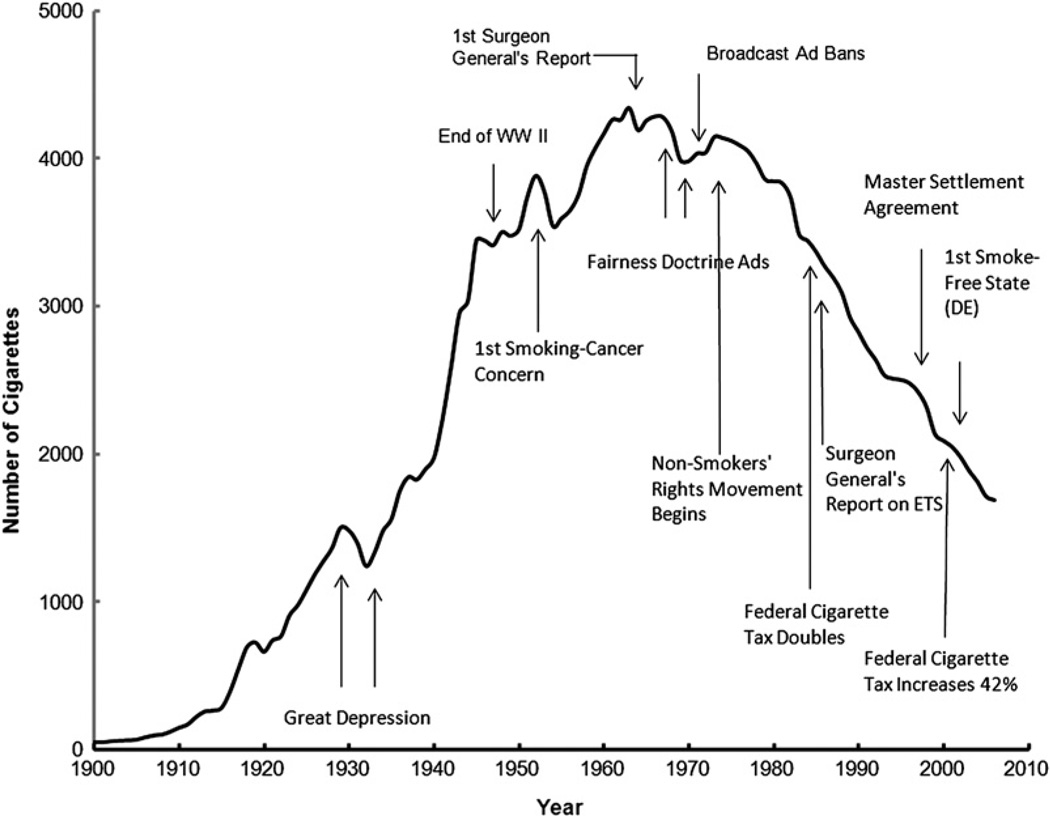
The adult per capita cigarette consumption in the United States, 1900–2006, with historical highlights. (Adapted from Warner KE, Mendez D. Tobacco control policy in developed countries: yesterday, today, and tomorrow. Nicotine Tob Res 2010;12(9):876–87; with permission.)
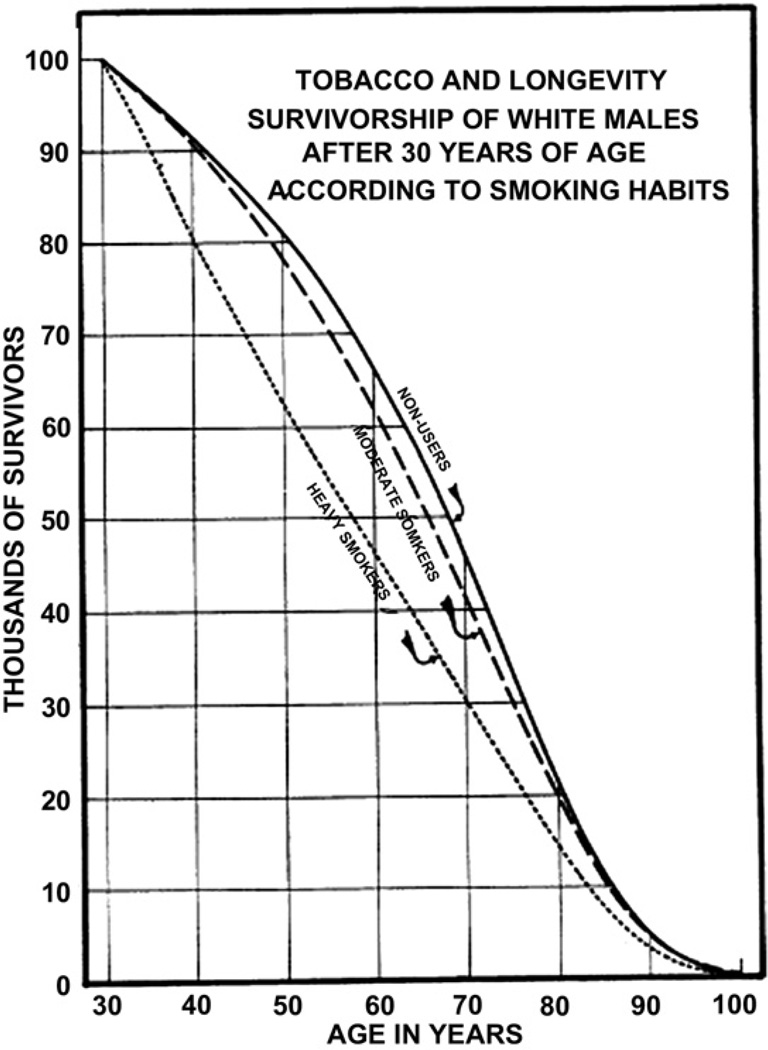
The survivorship lines of life tables for white men falling into 3 categories relative to the usage of tobacco. (A) Nonusers (solid line); (B) moderate smokers (dashed line); (C) heavy smokers (dotted line). (Adapted from Pear R. Tobacco smoking and longevity. Science 1938;87:216; with permission.)
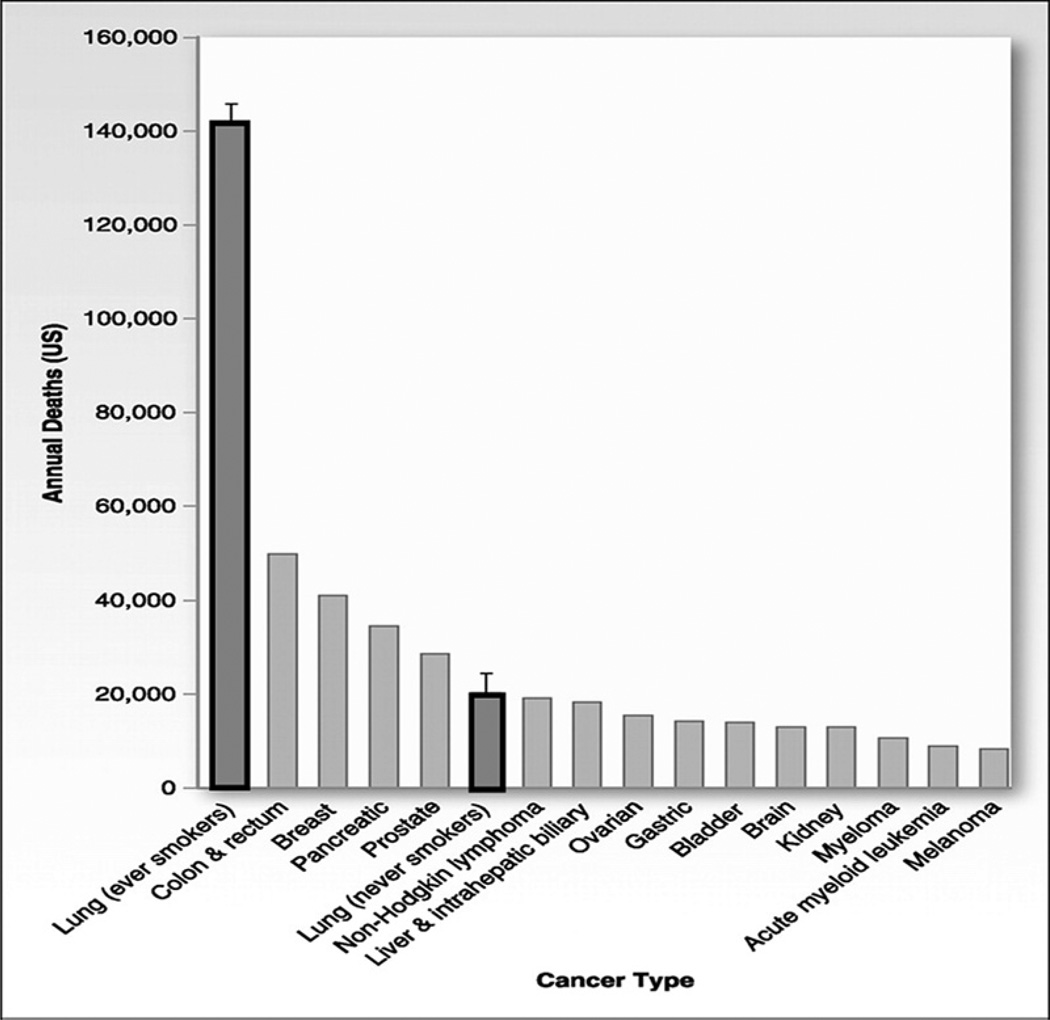
Common causes of cancer deaths in the United States with focus on never smokers. Total lung cancer deaths, estimated at 161,840 in 2008, have been split into ever smokers and never smokers. Error bars reflect that the number of lung cancer deaths in never smokers, including cases attributable to secondhand smoke exposure and cases not attributable to tobacco, are estimated to total 16,000 to 24,000 per year. (Adapted from Rudin CM, Avila-Tang E, Samet JM. Lung cancer in never smokers: a call to action. Clin Cancer Res 2009;15(18):5622–5; with permission.)
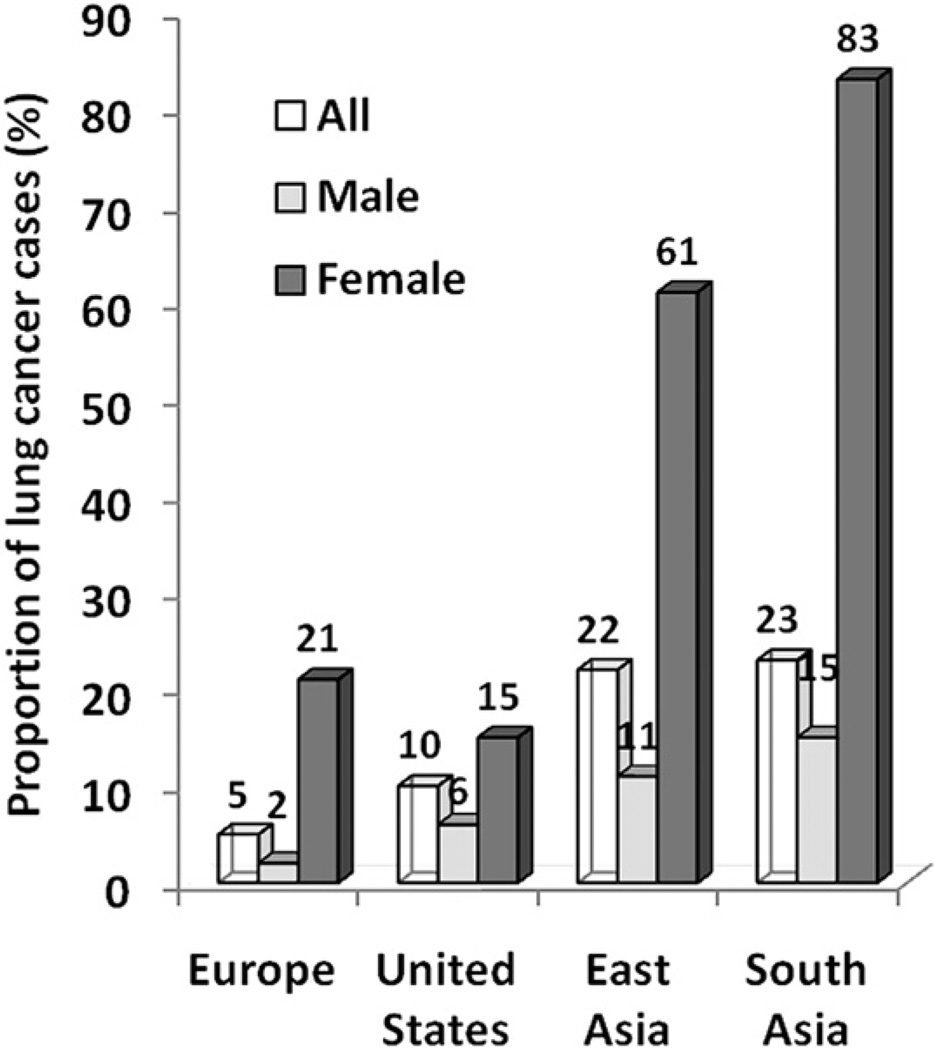
Geographic and gender variations of lung cancers in never smokers. Systematic compilation of published study involving 18 reports with 82,0237 cases. A marked gender bias was observed whereby lung cancer in never smokers seems to affect women more frequently than men, irrespective of geography. The proportion of female lung cancer cases in never smokers is particularly high in East Asia and South Asia. (Adapted from Sun S, Schiller JH, Gazdar AF. Lung cancer in never smokers—a different disease. Nat Rev Cancer 2007;7(10):778–90; with permission.)
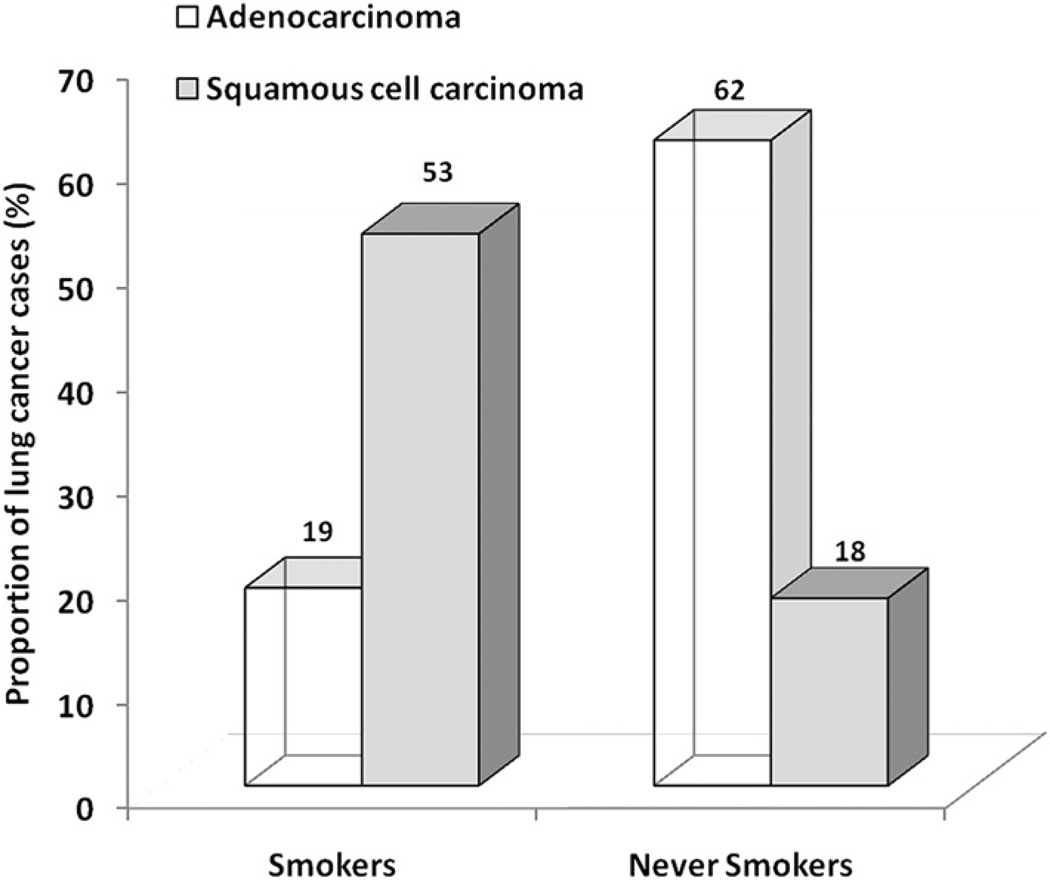
Different histologic features of lung cancer in never smokers. Histologic distribution of lung cancers in never smokers compared with smokers. Cases of bronchioloalveolar carcinoma included with adenocarcinoma. Histologic subtypes were classified as adenocarcinoma, squamous cell carcinoma, or others. Ratio of the number of adenocarcinoma to squamous cell carcinoma was 0.4:1 in smokers, whereas it was 3.4:1 in never smokers. (Adapted from Sun S, Schiller JH, Gazdar AF. Lung cancer in never smokers—a different disease. Nat Rev Cancer 2007;7(10):778–90; with permission.)
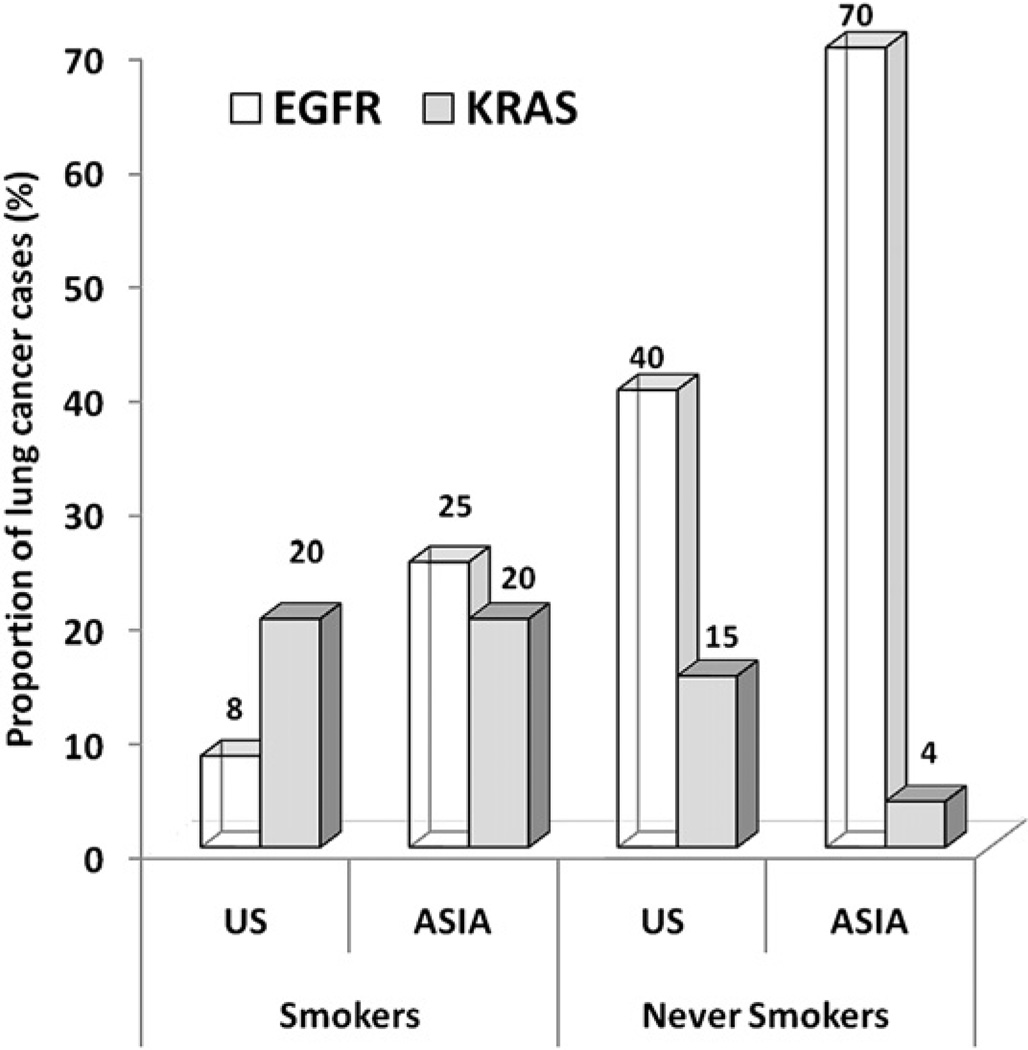
Differential frequencies of EGFR and K-ras mutations reported in lung adenocarcinomas in East Asia compared with the United States in never smokers and ever smokers. Activating mutations in both genes are found predominantly in adenocarcinomas, and occur in nonoverlapping cohorts. (Adapted from Rudin CM, Avila-Tang E, Harris CC, et al. Lung cancer in never smokers: molecular profiles and therapeutic implications. Clin Cancer Res 2009;15(18): 5646–61; with permission.)
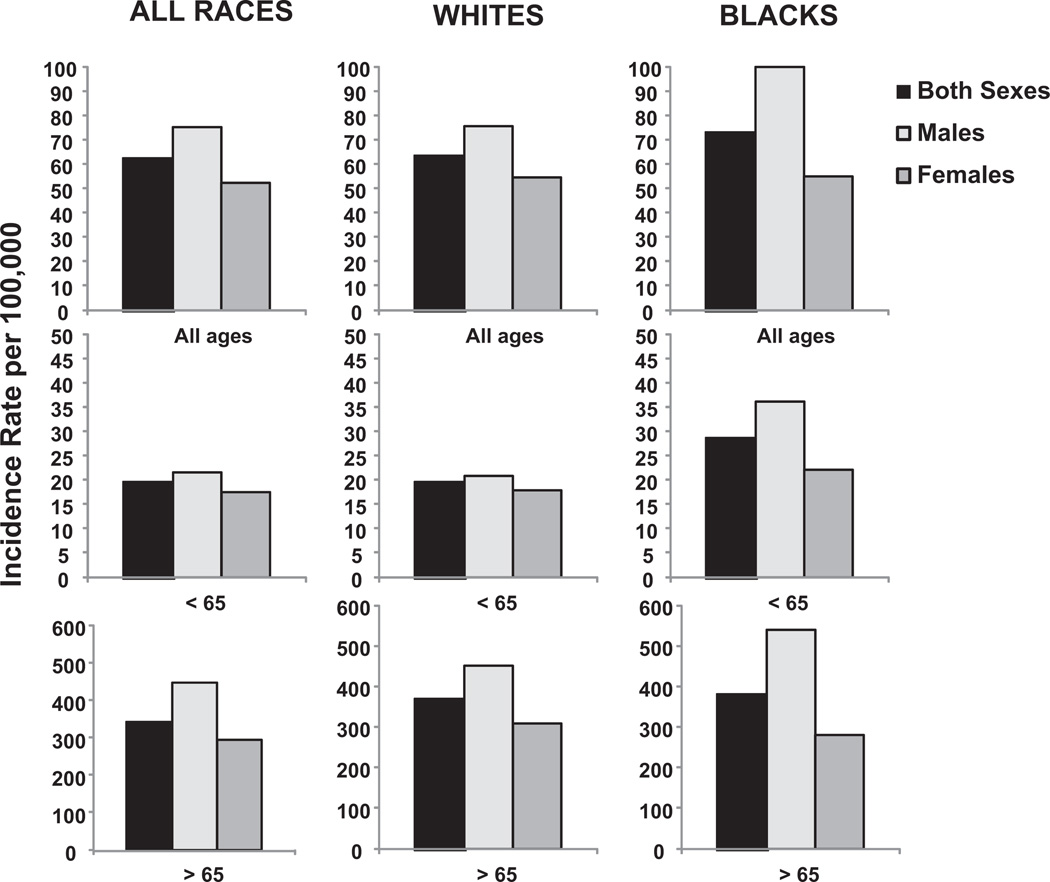
Age-adjusted lung cancer incidence by gender, age, and race. Rates are per 100,000 and are age adjusted to the 2000 US standard population. Note the different scale, which highlights the predominant incidence of lung cancer in the population age >65 years for both genders and races. (Data from Siegel R, Ward E, Brawley O, et al. Cancer statistics, 2011: the impact of eliminating socioeconomic and racial disparities on premature cancer deaths. CA Cancer J Clin 2011;61(4):212–36; and Howlader N, Noone AM, Krapcho M, et al, editors. SEER Cancer Statistics Review, 1975–2008. Bethesda (MD): National Cancer Institute; 2010. Available at: http://seer.cancer.gov/csr/1975_2008/ , based on November 2010 SEER data submission, posted to the SEER web site, 2011.)
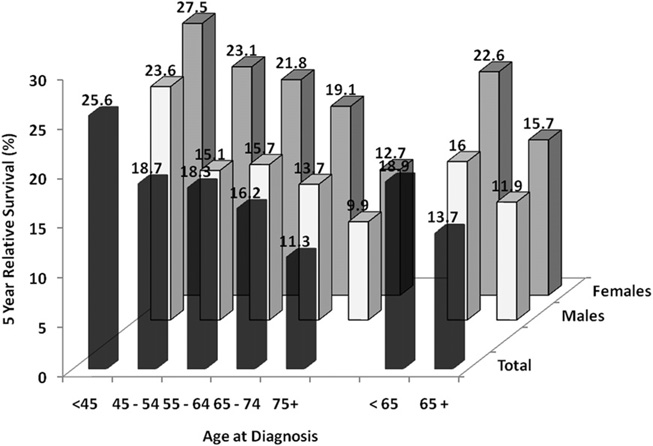
Five-year relative survival (%) from lung cancer based on age at diagnosis. Based on data from 2001 to 2008 covering SEER 17 areas. (Data from Howlader N, Noone AM, Krapcho M, et al, editors. SEER Cancer Statistics Review, 1975–2008. Bethesda (MD): National Cancer Institute; 2010. Available at: http://seer.cancer.gov/csr/1975_2008/ , based on November 2010 SEER data submission, posted to the SEER web site, 2011.
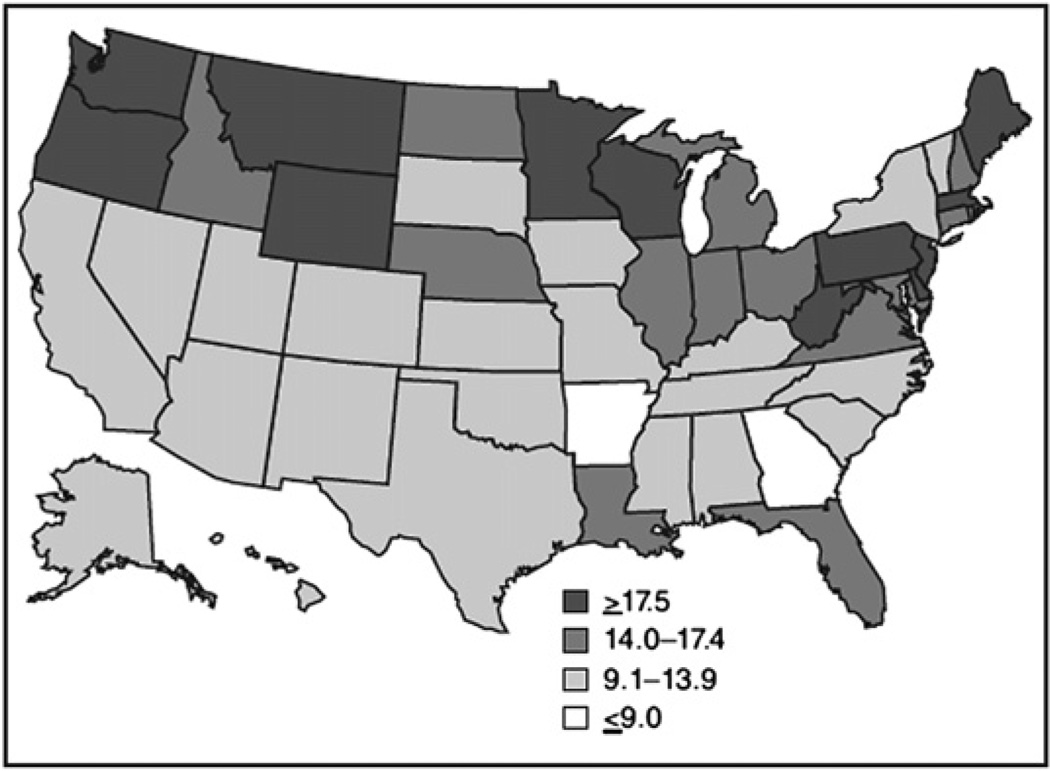
Malignant mesothelioma death rate per 1 million population by state in the United States from 1999 to 2005. Map of the United States indicates the malignant mesothelioma death rate per 1million population for each state during 1999–2005. The state death rate was greater than the national rate of 13.8 per million population per year in 26 states; in 6 states (Maine, New Jersey, Pennsylvania, Washington, Wyoming, and West Virginia), the rate exceeded 20 per million per year. (Adapted from Bang KM, Mazurek JM, Storey E, et al. Malignantmesotheliomamortality—UnitedStates, 1999–2005. MMWR 2009;58(15):393–6.)
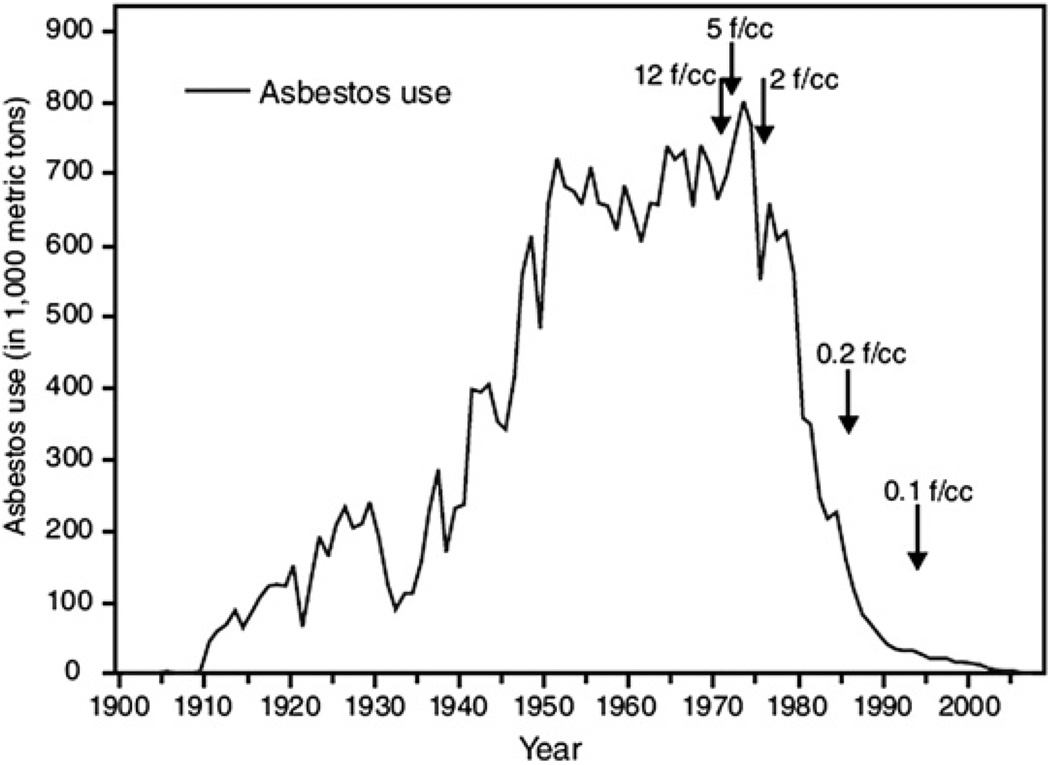
Asbestos use and permissible exposure limits in the United States from 1900 to 2007. The amount of asbestos use, in thousands of metric tons, and the Occupational Safety and Health Administration permissible asbestos exposure limits in the United States during 1900–2007 are shown. Asbestos use increased from 1000 metric tons in 1900 to a peak of 803,000 metric tons in 1973, then decreased to approximately 1700 metric tons in 2007. Permissible asbestos exposure limits were 12 fibers per cubic centimeter (f/cc) in 1971, 5 f/cc in 1972, 2 f/cc in 1976, 0.2 f/cc in 1986, and 0.1 f/cc in 1994. Arrows indicate year when the Occupational Safety and Health Administration permissible exposure limits were put in place. (Adapted from Bang KM, Mazurek JM, Storey E, et al. Malignant mesothelioma mortality—United States, 1999–2005. MMWR 2009;58(15):393–6.)
References
-
- Siegel R, Ward E, Brawley O, et al. Cancer statistics, 2011: the impact of eliminating socioeconomic and racial disparities on premature cancer deaths. CA Cancer J Clin. 2011;61(4):212–236. - PubMed
-
- Jemal A, Bray F, Center MM, et al. Global cancer statistics. CA Cancer J Clin. 2011;61(2):69–90. - PubMed
-
- Howlader N, Noone AM, Krapcho M, et al., editors. SEER Cancer Statistics Review, 1975–2008. Bethesda (MD): National Cancer Institute; 2010. Available at: http://seer.cancer.gov/csr/1975_2008/, based on November 2010 SEER data submission, posted to the SEER web site, 2011.
Publication types
MeSH terms
Grants and funding
LinkOut - more resources
Full Text Sources
Other Literature Sources
Medical
