. 2011 Nov 23;35(5):705-20.
doi: 10.1016/j.immuni.2011.10.004. Epub 2011 Nov 4.

Functional nanoscale organization of signaling molecules downstream of the T cell antigen receptor

Affiliations

Functional nanoscale organization of signaling molecules downstream of the T cell antigen receptor

Eilon Sherman et al. Immunity. .

Abstract

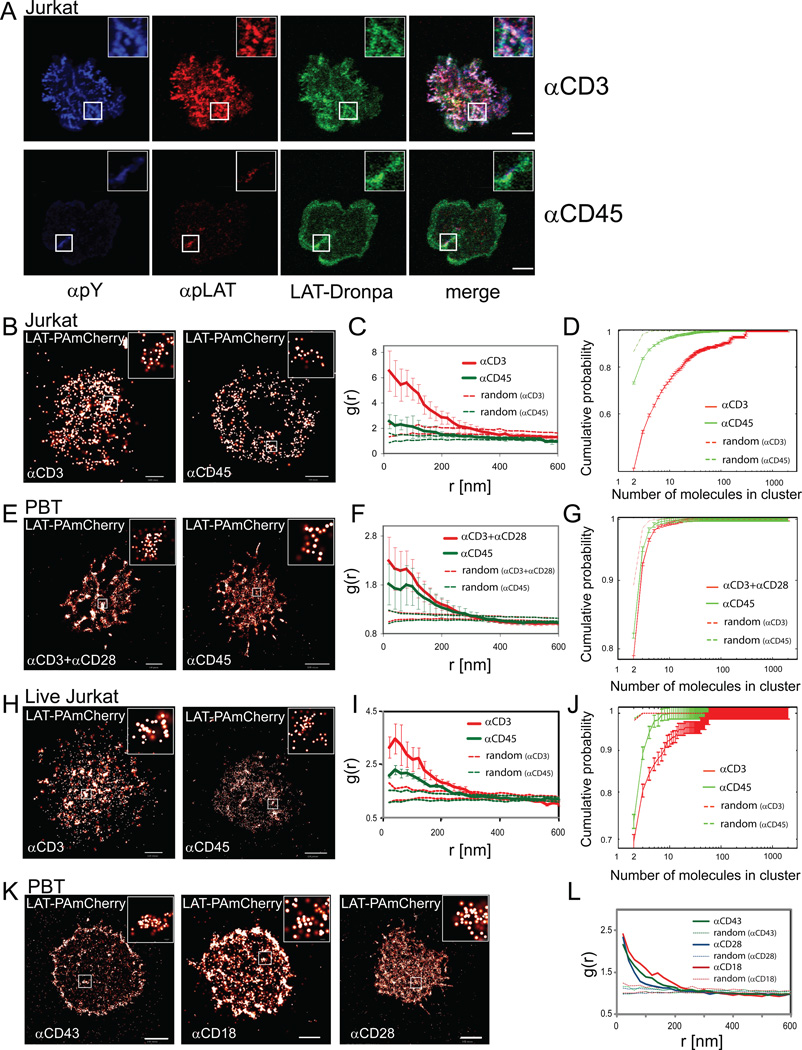
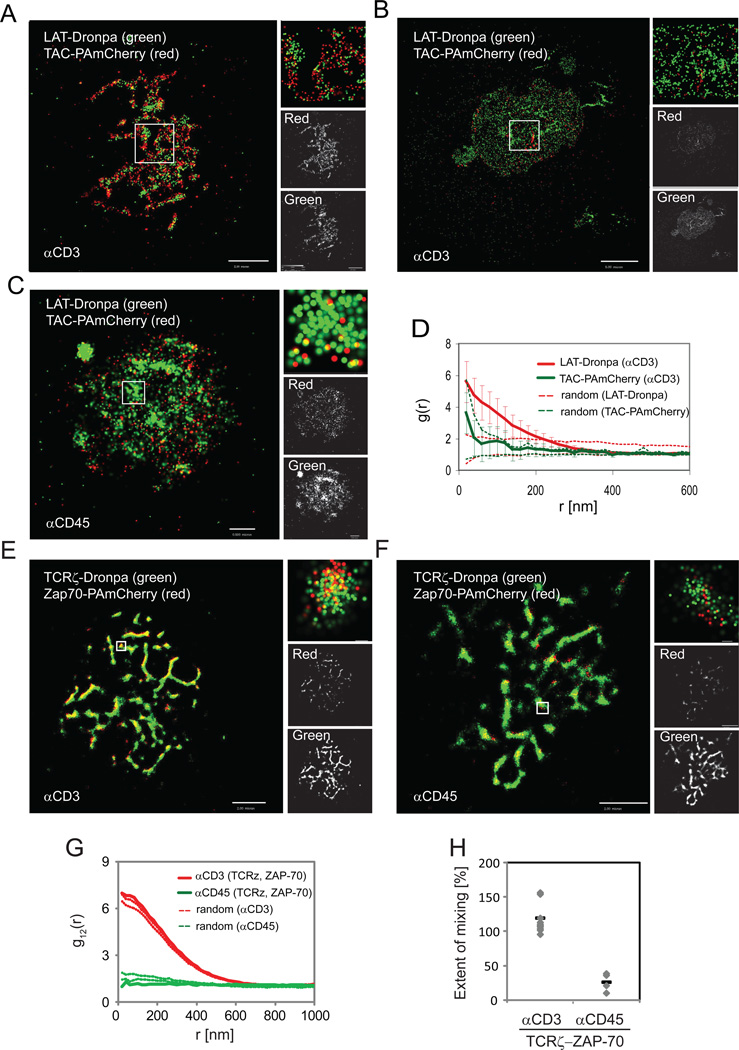
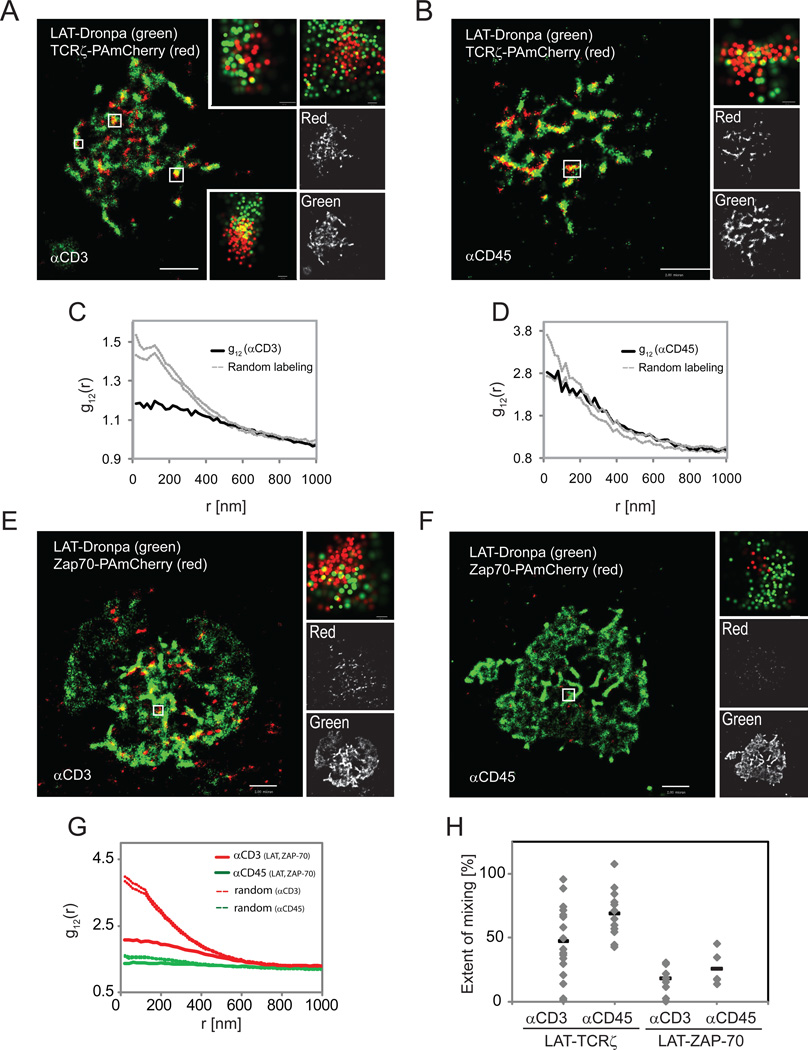
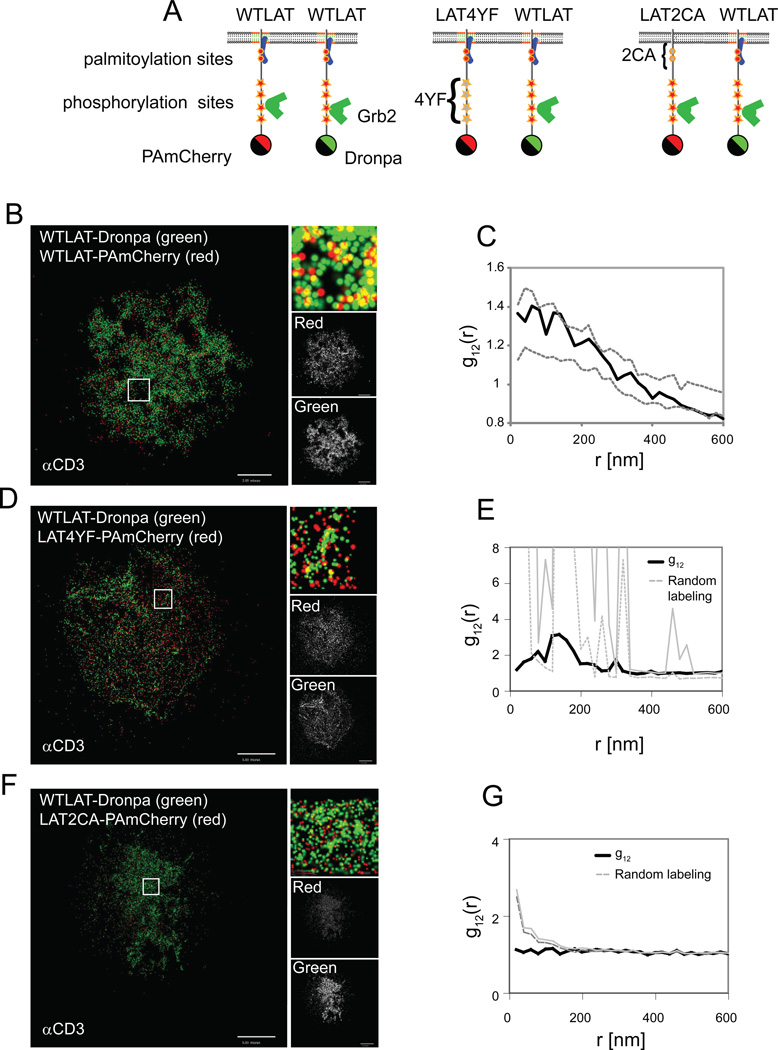
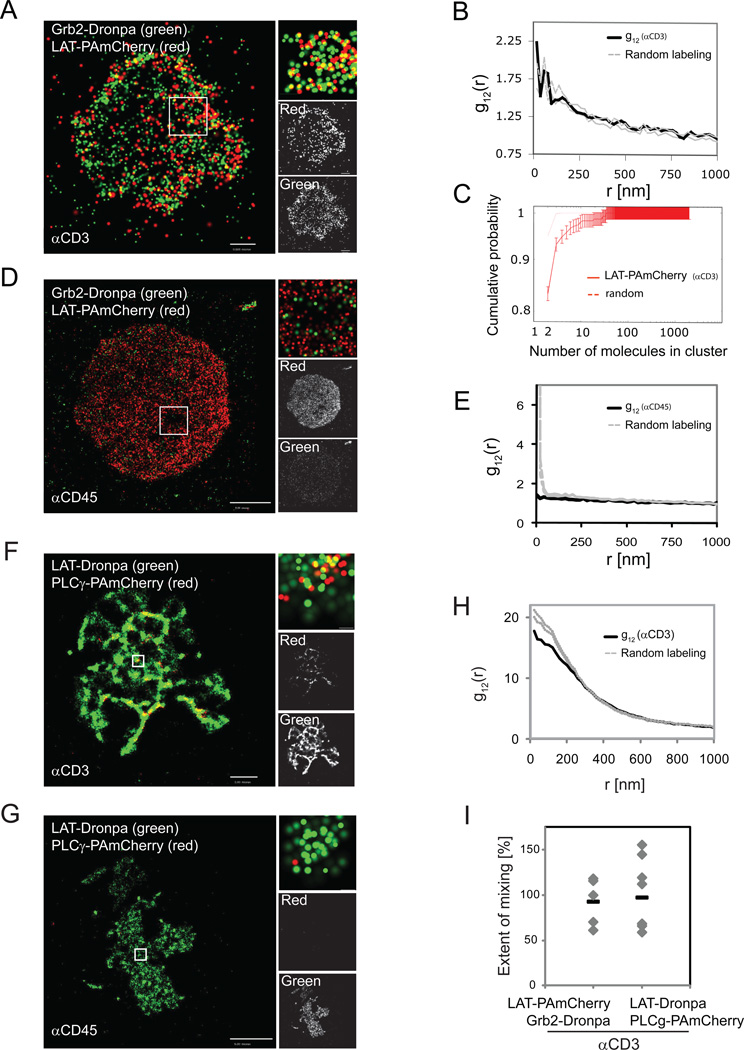
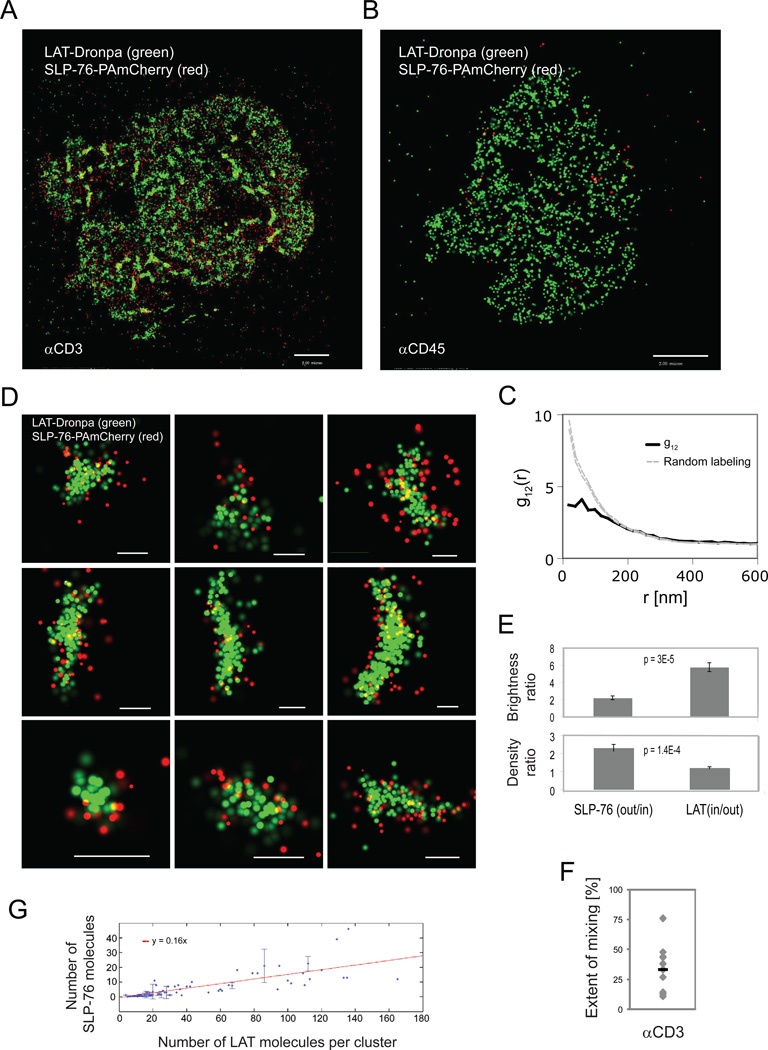
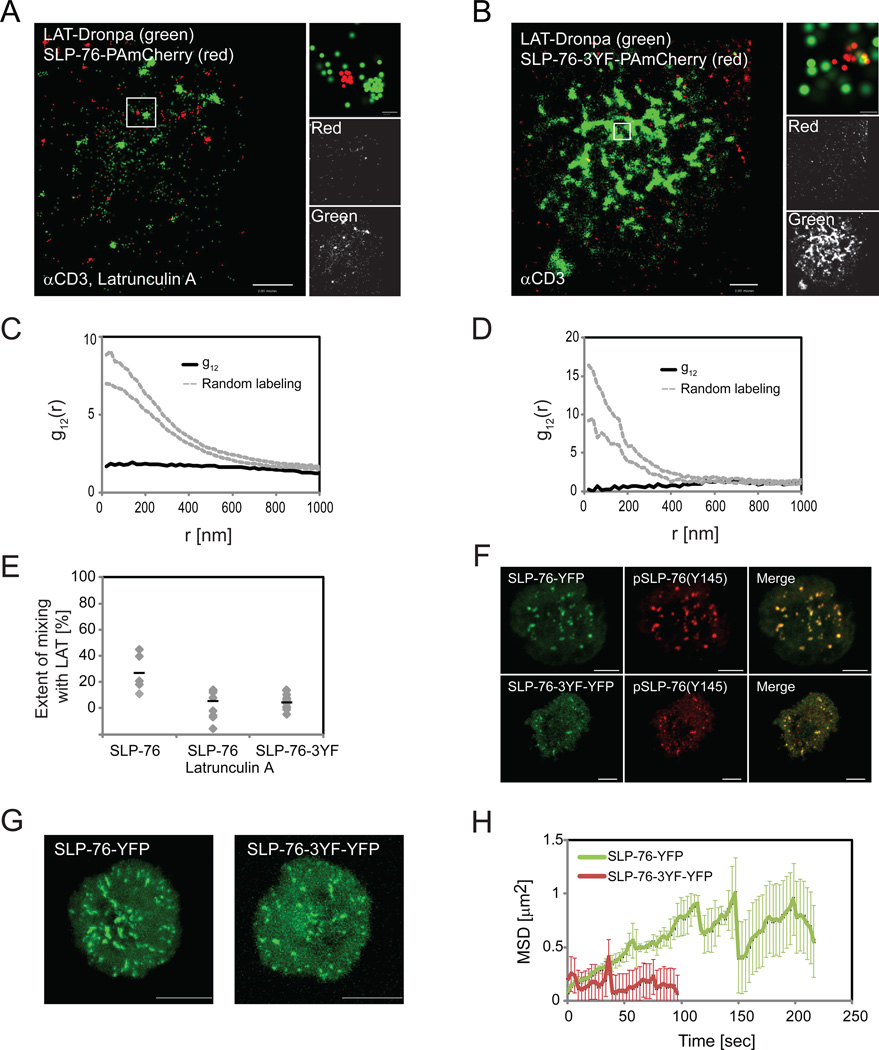
Receptor-regulated cellular signaling often is mediated by formation of transient, heterogeneous protein complexes of undefined structure. We used single and two-color photoactivated localization microscopy to study complexes downstream of the T cell antigen receptor (TCR) in single-molecule detail at the plasma membrane of intact T cells. The kinase ZAP-70 distributed completely with the TCRζ chain and both partially mixed with the adaptor LAT in activated cells, thus showing localized activation of LAT by TCR-coupled ZAP-70. In resting and activated cells, LAT primarily resided in nanoscale clusters as small as dimers whose formation depended on protein-protein and protein-lipid interactions. Surprisingly, the adaptor SLP-76 localized to the periphery of LAT clusters. This nanoscale structure depended on polymerized actin and its disruption affected TCR-dependent cell function. These results extend our understanding of the mechanism of T cell activation and the formation and organization of TCR-mediated signaling complexes, findings also relevant to other receptor systems.


Figures

Figure 1
Figure 1. LAT clusters at the PM are mainly in small nanoclusters
(A) Confocal images of Jurkat E6.1 T cells on αCD3- or αCD45-coated coverslips. Cells were stained for pY (blue), pLAT(pY191, red) and stably expressed LAT-Dronpa (green). Bar - 10 µm. Insets show a magnified view of a microcluster. (B) PALM images of Jurkat T cells expressing LAT-PAmCherry spread on αCD3 or spread on αCD45. Insets show nano-scale organization of individual molecules within apparent microclusters. Color codes (heat map, white is highest) for overlapping probability density functions of individual molecules, with a maximal value of 410 molecules/µm2 on αCD3 and 360 molecules/µm2 on αCD45. Bars – 0.5 µm and 1 µm, respectively. (C) Pair correlation function (PCF) of LAT-PAmCherry molecules (n=7 cells for stimulating and non-stimulating conditions; dashed lines indicate upper and lower 95% confidence levels of a Heterogeneous Poisson process; see Analyses section in SI for further details). (D) Results of a clustering algorithm to resolve individual clusters and generate cumulative size-distribution curves of the LAT clusters seen under stimulating and non-stimulating conditions. (n=12 cells for stimulating and 10 for non-stimulating conditions; dashed lines represent clustering of random sets; the two dashed lines overlap; see SI for further details on statistical analyses). (E) PALM images of peripheral blood lymphocytes (PBLs) expressing LAT-PAmCherry spread on either αCD3+αCD28- or on αCD45-coated coverslips. Insets show nano-scale organization of individual molecules within apparent microclusters. Maximal density values are 740 molecules/µm2 and 490 molecules/µm2, respectively. Bars – 1 µm (left) and 2 µm (right). (F) The PCF of LAT-PAmCherry molecules (n=8 cells for stimulating and non-stimulating conditions; dashed lines defined as in panel C). (G) The cluster analyses showing cumulative size-distribution curves. (n=12 cells for stimulating and n=10 for non-stimulating conditions; dashed lines represent clustering of random sets; the two dashed lines overlap; see SI for further details on statistical analyses). (H) PALM image of a live Jurkat T cell expressing LAT-PAmCherry spread on αCD3- or on αCD45-coated surface. Maximal density value 50 molecules/µm2 for both panels. Bars - 2 µm (I) PCF of LAT-PAmCherry molecules (n=3 cells for stimulating and non-stimulating conditions; dashed lines defined as in panel C). (J) Clustering analyses (n=3 cells for stimulating and non-stimulating conditions). See Materials and Methods section in SI and Figure S1K for further details regarding live cell imaging with PALM. (K) Peripheral blood T (PBT) cells expressing LAT-PAmCherry plated onto αCD43-, αCD18- or αCD28-coated coverslips. Bars - 2µm. (L) PCFs of LAT-PAmCherry molecules (dashed lines defined as in panel C).
Figure 2
Figure 2. Two-color PALM captures the mutual organization and interactions of signaling molecules at the PM
(A,B,C) LAT is recruited to early contact areas within lamellae. Two-color PALM images of Jurkat cells expressing LAT-Dronpa (green) and TAC-PAmCherry (red) under stimulating conditions, showing (A) partial or (B) complete spreading, or (C) cells under non-stimulating conditions showing partial spreading. Right panels show a zoomed image of the region of interest, a single color rendering of TAC-PAmcherry (labelled red) and LAT-dronpa (labelled green). Maximal probability density values (as detailed in Figure 1B) for LAT-Dronpa and TAC-PAmCherry – (A) 270 and 1340 molecules/µm2, respectively; (B) 190 and 10 molecules/µm2; (C) 126 and 59 molecules/µm2. Bars – (A) 2µm, (B) 5µm, (C) 0.5µm. (D) The PCF of LAT-Dronpa (red line) and TAC-PAmCherry (green line) under stimulating conditions (n=5 cells; Dashed lines indicate upper and lower 95% confidence levels of a Heterogeneous Poisson process). See Figure S2F,G for the related PCFs for non-stimulating conditions. (E,F,G,H) ZAP-70 is well co-localized with TCRζ in activated T cells. Two-color PALM images of Jurkat T cells expressing TCRζ-Dronpa and ZAP-70-PAmCherry on (E) αCD3- and (F) αCD45-coated coverslips. Insets show zoomed images of individual TCRζ and ZAP-70 clusters (bars – 200nm). (G) Bivariate correlation curves of TCRζ and ZAP-70 for αCD3 (red lines) and αCD45 (green lines). Dashed lines indicate upper and lower 95% confidence levels of a random labeling (homogeneous mixing) model (H) The extent of mixing between TCRζ and ZAP-70 (as defined in the text) are compared between activating and non-activating conditions for multiple cells expressing TCRζ and ZAP-70 (n=13 for αCD3, and n=5 for αCD45). Maximal probability density values (as detailed in Figure 1B) for TCRζ-Dronpa and ZAP-70-PAmCherry – (E) 1580 and 1630 molecules/µm2, respectively, (F) 1070 and 1610 molecules/µm2. Bars – 2µm.
Figure 3
Figure 3. LAT and TCRζ exist in overlapping pools, where nanoscale domains could function as hot spots of T cell activation
Two-color PALM images of a LAT-Dronpa- and TCRζ-PAmCherry-expressing Jurkat T cell (A) on αCD3- or (B) αCD45-coated coverslips. Zoomed images (insets) of individual TCRζ and LAT clusters are shown (bars – 100nm). (C) Bivariate correlation curves for αCD3 (Dashed lines indicate upper and lower 95% confidence levels of a Heterogeneous Poisson process). (D) Bivariate correlation curve for non-activating conditions (Dashed lines defined as in panel C). Maximal probability density values (as detailed in Figure 1B) for LAT-Dronpa and TCRζ-PAmCherry – (A) 1380 and 1120 molecules/µm2, respectively; (D) 510 and 400 molecules/µm2. Bars – 2µm. (E,F,G,H) ZAP-70 is poorly co-localized with LAT. Two-color PALM images of Jurkat T cells expressing LAT-Dronpa and ZAP-70-PAmCherry on (E) αCD3- or (F) αCD45-coated coverslips. Zoomed images (insets) of individual LAT and ZAP-70 clusters (bars – 200nm). (G) Bivariate correlation curves of LAT and ZAP-70 for αCD3 (red lines) and for αCD45 (green lines). Dashed lines defined as in panel C. (H) The extent of mixing between LAT and TCRζ or LAT and ZAP-70 are compared between activating and non-activating conditions for multiple cells (LAT and TCRζ - n=19 for αCD3, and n=14 for αCD45; LAT and ZAP-70 - n=13 for αCD3, and n=4 for αCD45). See definition of the mixing coefficient in the text. Maximal probability density values (as detailed in Figure 1B) for TCRζ-Dronpa and ZAP-70-PAmCherry – (A) 1580 and 1630 molecules/µm2, respectively, (B) 1070 and 1610 molecules/µm2 (C) 1500 and 1260 molecules/µm2, (D) 1400 and 440 molecules/µm2. Bars – 2µm.
Figure 4
Figure 4. Protein-protein and protein-lipid interactions are both required for LAT intact nanocluster formation
(A) A cartoon showing the position of LAT mutations and their effect on LAT interactions. The 4YF mutations prevent the binding of adapter proteins such as Grb2 and the 2CA mutations prevent LAT palmitoylation and recruitment to lipid rafts. Two-color PALM images of activated Jurkat T cells expressing (B) WTLAT-Dronpa and WTLAT-PAmCherry and (C) their bivariate analyses or Jurkat cells expressing (D,E) WTLAT-Dronpa and 4YF-LAT-PAmCherry or (F,G) WTLAT-Dronpa and 2CA-LAT-PAmCherry. In each panel, the PALM images show two-color rendering of WTLAT-Dronpa (green), WT- or mutated-LAT-PAmCherry (red) and a zoomed image in the inset. The univariate PCF curves of the cells are shown in Figure S3A-C. Dashed grey lines in panels C, E and G indicate upper and lower 95% confidence levels of the random labeling model. See Analyses section in SI for further details. Color codes of PALM images (bright is highest) for individual probability density functions of single molecules, with maximal values for WTLAT-Dronpa and mutant or WTLAT-PAmCherry of – (B) 100 and 100 molecules/µm2, respectively; (D) 180 and 120 molecules/µm2; (F) 310 and 470 molecules/µm2, respectively. Bars – 5µm
Figure 5
Figure 5. LAT clusters of all sizes can recruit Grb2 upon TCR stimulation, while PLC-γ1 is most efficiently recruited in isolated clusters
(A) PALM of Jurkat cells expressing Grb2-Dronpa and WTLAT-PAmCherry on αCD3-coated coverslips. (B) Bivariate PCFs indicate colocalization of Grb2 and LAT on αCD3-coated coverslips (in black; random labeling model in grey, upper and lower confidence levels of 95%). (C) Cumulative probability function (n=7 cells, as detailed in Figure 1). (D) PALM of Jurkat cells expressing Grb2-Dronpa and WTLAT-PAmCherry on αCD45-coated coverslips. (E) Bivariate PCF between LAT and Grb2 on αCD45-coated coverslips (dashed grey lines defined as in panel B). (F-I) PALM analysis of Jurkat cells expressing LAT-Dronpa and PLC-γ1-PAmCherry spread on (F) αCD3- or (G) αCD45-coated coverslips. (H) Bivariate PCFs indicate colocalization of PLC-γ1 and LAT on αCD3-coated coverslips (in black; dashed grey lines defined as in panel B). (I) The extent of mixing between of LAT-PAmCherry and Grb2 Dronpa or PLC-γ1 and LAT (n=5 for LAT-PAmCherry and Grb2-Dronpa, and n=8 for LAT-Dronpa and PLCγ1-PAmCherry). Maximal probability density values (as detailed in Figure 1B) for Grb2-Dronpa and LAT-PAmCherry – (A) 640 and 260 molecules/µm2, respectively; (D) 540 and 860 molecules/µm2. Bars – (A) 0.5 µm, (D) 2 µm. Maximal probability density values (as detailed in Figure 1B) for LAT-Dronpa and PLC-γ1-PAmCherry – (F) 730 and 290 molecules/µm2, respectively; (G) 370 and 120 molecules/µm2. Bars – (F) 2 µm, (G) 5 µm.
Figure 6
Figure 6. Nano-scale organization of SLP-76 is revealed at the rim of LAT clusters upon TCR stimulation
Two-color PALM images of a LAT-Dronpa and SLP-76-PAmCherry expressing Jurkat T cell (A) on αCD3- (B) αCD45-coated coverslips and (C) Bivariate correlation curve (dashed grey lines indicate 95% confidence levels of a random labeling model). (D) Zoomed images of individual LAT clusters showing preferential organization of SLP-76 at the rims of LAT clusters. Bars – 200nm. (E) Top - ratio of LAT and SLP-76 brightness in the rim vs. inner part of the cluster, as identified by image processing (n=10 clusters). Bottom - density ratios of LAT and SLP-76 as calculated by dividing the brightness measurements with the matching areas of the rim and inner part of the cluster (n=10 clusters). (F) The extent of mixing between LAT and SLP-76 (n=10 cells). (G) SLP-76 molecules were associated with LAT clusters using the clustering algorithm (see Analyses section in SI and Figure S1M,N for further details). The number of SLP-76 molecules in LAT clusters is plotted as a function of LAT cluster size (in copy number). A linear fit indicates linear efficiency of recruiting SLP-76 molecules to LAT clusters as a function of LAT cluster size. Maximal probability density values (as detailed in Figure 1B) for LAT-Dronpa and SLP-76-PAmCherry – (A) 310 and 310 molecules/µm2, respectively; (D) 320 and 310 molecules/µm2. Bars – 2 µm.
Figure 7
Figure 7. Nano-scale organization of SLP-76 depends on actin and facilitates regulation of SLP-76 clusters
Two-color PALM images of (A) a LAT-Dronpa and SLP-76-PAmCherry-expressing Jurkat T cells treated with 300nM Latrunculin A and (B) a LAT-Dronpa and SLP-76-3YF-PAmCherry-expressing Jurkat T cells. (A,B) cells were imaged on αCD3-coated coverslips. (C,D) The bivariate correlation curves related to cells in panels A and B in cells treated with (C) Latrunculin A or (D) between LAT and the SLP76-3YF mutant (Dashed grey lines indicate 95% confidence level of a random labeling model). (E) The extent of mixing derived from imaging multiple cells as in panel A (n=8) and panel B (n=10) and cells expressing LAT-Dronpa and SLP-76-PAmCherry (n=5). (F,G,H) Jurkat T cells, transiently expressing SLP-76-YFP or SLP-76-3YF-YFP, were imaged by confocal microscopy as they spread on αCD3-coated coverslips. (F) Confocal images of fixed cells expressing SLP-76-YFP or SLP-76-3YF-YFP and stained with αphosphoSLP-76(Y145). (G) Images are shown summing all frames from Maximal intensity projection (MIP) movies (see related Movies S1 and S2). These images describe SLP-76 cluster movement across the plasma membrane for SLP-76 or SLP-76-3YF. (H) Individual clusters containing SLP-76 or SLP-76-3YF were identified and tracked in the MIP movies using SlideBook (3i) as described in the methods section. An average of the mean squared displacement (MSD) over time was calculated for multiple trajectories from multiple cells (SLP-76, n=2496 from 19 cells; SLP-76-3YF, n=233 from 10 cells as a significantly lower number of clusters could be detected for the SLP-76-3YF expressing cells). Maximal probability density values (as detailed in Figure 1B) for LAT-Dronpa and SLP-76-PAmCherry – (A) 400 and 240 molecules/µm2, respectively; (B) 640 and 520 molecules/µm2. Bars – 2 µm.

References

    1. Ando R, Mizuno H, Miyawaki A. Regulated fast nucleocytoplasmic shuttling observed by reversible protein highlighting. Science. 2004;306:1370–1373. - PubMed
    1. Balagopalan L, Barr VA, Sommers CL, Barda-Saad M, Goyal A, Isakowitz MS, Samelson LE. c-Cbl-mediated regulation of LAT-nucleated signaling complexes. Molecular and Cellular Biology. 2007;27:8622–8636. - PMC - PubMed
    1. Balagopalan L, Coussens NP, Sherman E, Samelson LE, Sommers CL. The LAT story: a tale of cooperativity, coordination, and choreography. Cold Spring Harb Perspect Biol. 2010;2:a005512. - PMC - PubMed
    1. Barda-Saad M, Braiman A, Titerence R, Bunnell SC, Barr VA, Samelson LE. Dynamic molecular interactions linking the T cell antigen receptor to the actin cytoskeleton. Nature Immunology. 2005;6:80–89. - PubMed
    1. Barda-Saad M, Shirasu N, Pauker MH, Hassan N, Perl O, Balbo A, Yamaguchi H, Houtman JC, Appella E, Schuck P, et al. Cooperativ interactions at the SLP-76 complex are critical for actin polymerization. EMBO J. 2010;29:2315–2328. - PMC - PubMed

Publication types

MeSH terms