

Semiparametric estimation of the relationship between ROC operating points and the test-result scale: application to the proper binormal model
- PMID: 22055797
- PMCID: PMC3368704
- DOI: 10.1016/j.acra.2011.08.003
Semiparametric estimation of the relationship between ROC operating points and the test-result scale: application to the proper binormal model
Abstract
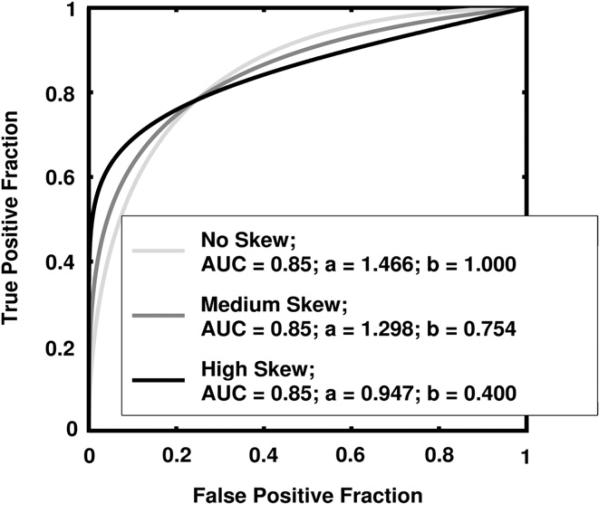
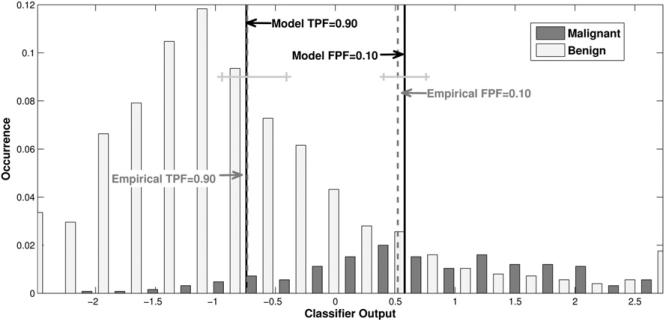
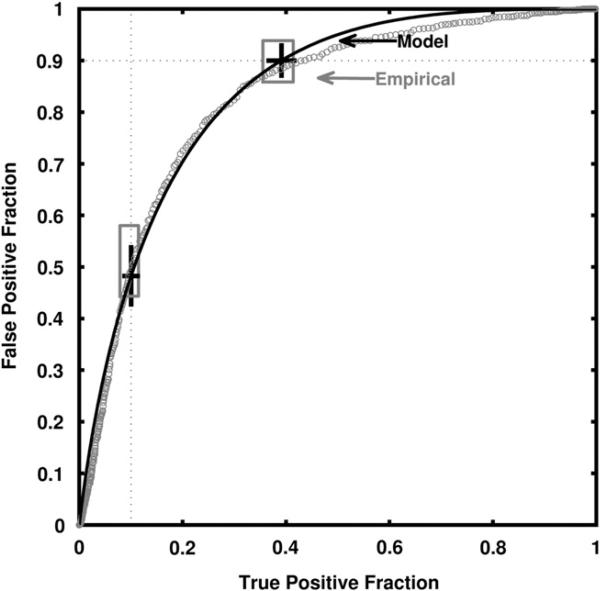
Rationale and objectives: Semiparametric methods provide smooth and continuous receiver operating characteristic (ROC) curve fits to ordinal test results and require only that the data follow some unknown monotonic transformation of the model's assumed distributions. The quantitative relationship between cutoff settings or individual test-result values on the data scale and points on the estimated ROC curve is lost in this procedure, however. To recover that relationship in a principled way, we propose a new algorithm for "proper" ROC curves and illustrate it by use of the proper binormal model.
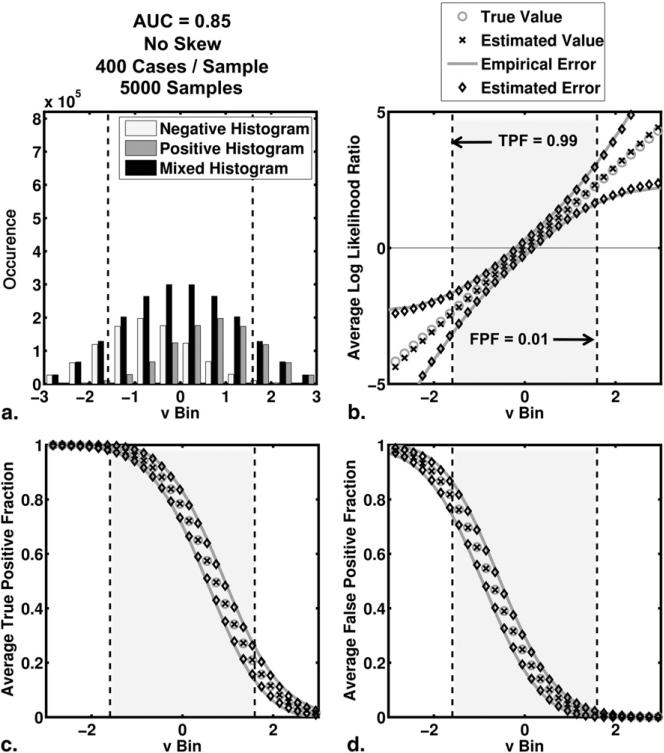
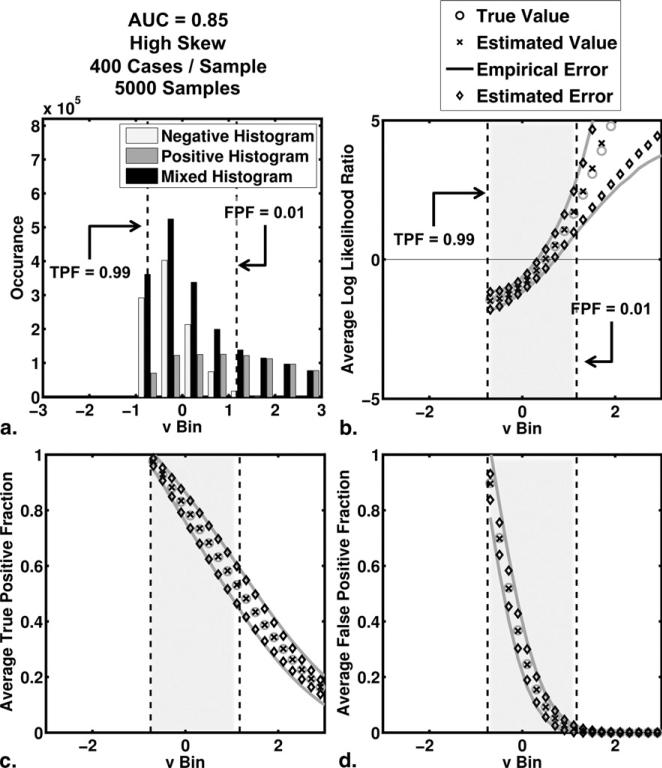
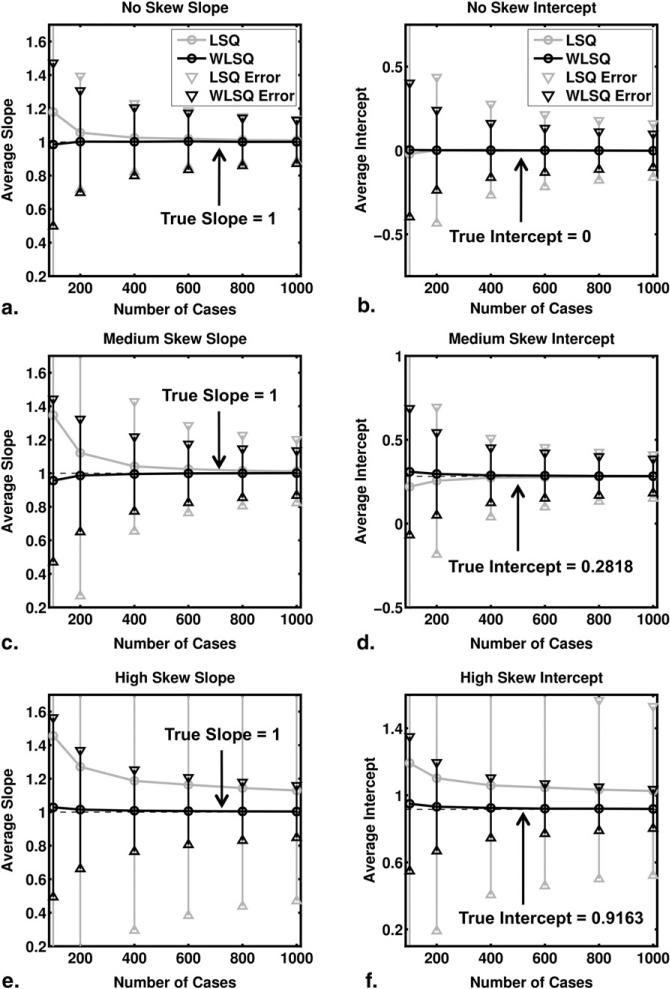
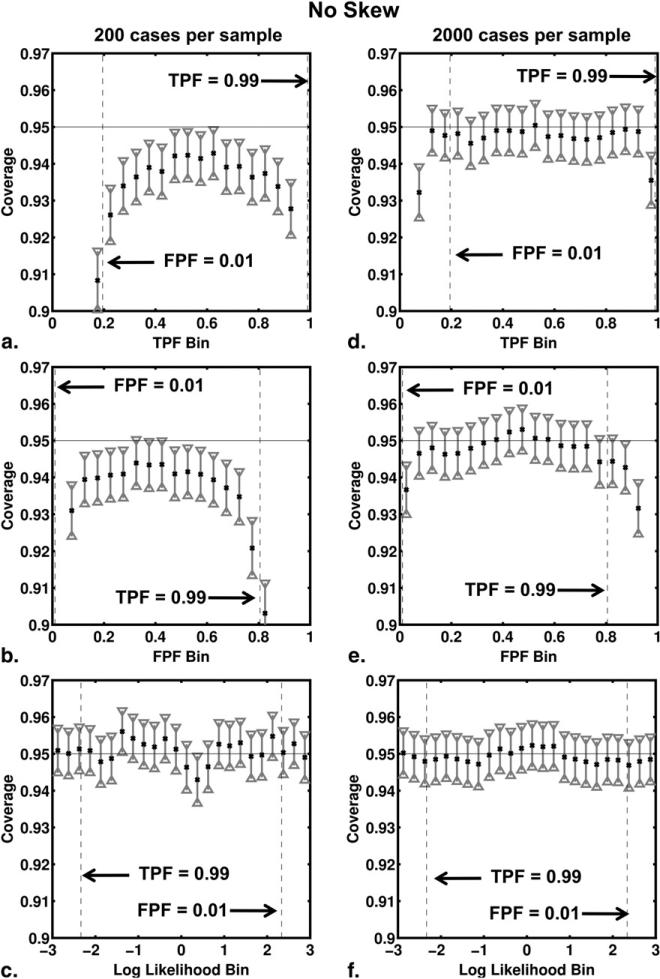
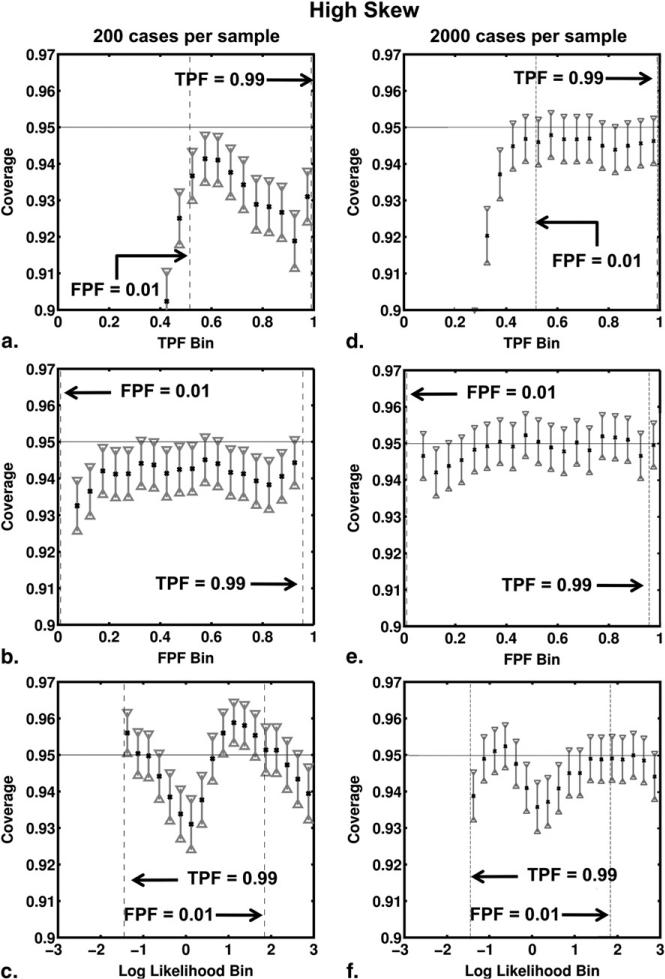
Materials and methods: Several authors have proposed the use of multinomial distributions to fit semiparametric ROC curves by maximum-likelihood estimation. The resulting approach requires nuisance parameters that specify interval probabilities associated with the data, which are used subsequently as a basis for estimating values of the curve parameters of primary interest. In the method described here, we employ those "nuisance" parameters to recover the relationship between any ordinal test-result scale and true-positive fraction, false-positive fraction, and likelihood ratio. Computer simulations based on the proper binormal model were used to evaluate our approach in estimating those relationships and to assess the coverage of its confidence intervals for realistically sized datasets.
Results: In our simulations, the method reliably estimated simple relationships between test-result values and the several ROC quantities.
Conclusion: The proposed approach provides an effective and reliable semiparametric method with which to estimate the relationship between cutoff settings or individual test-result values and corresponding points on the ROC curve.
Copyright © 2011 AUR. Published by Elsevier Inc. All rights reserved.
Figures
Similar articles
-
The "proper" binormal model: parametric receiver operating characteristic curve estimation with degenerate data.Acad Radiol. 1997 May;4(5):380-9. doi: 10.1016/s1076-6332(97)80121-3. Acad Radiol. 1997. PMID: 9156236
-
A bivariate contaminated binormal model for robust fitting of proper ROC curves to a pair of correlated, possibly degenerate, ROC datasets.Med Phys. 2017 Jun;44(6):2207-2222. doi: 10.1002/mp.12263. Epub 2017 May 18. Med Phys. 2017. PMID: 28382718
-
Estimating the Area Under ROC Curve When the Fitted Binormal Curves Demonstrate Improper Shape.Acad Radiol. 2017 Feb;24(2):209-219. doi: 10.1016/j.acra.2016.09.020. Epub 2016 Nov 21. Acad Radiol. 2017. PMID: 27884464 Free PMC article.
-
Receiver-operating characteristic curves and likelihood ratios: improvements over traditional methods for the evaluation and application of veterinary clinical pathology tests.Vet Clin Pathol. 2006 Mar;35(1):8-17. doi: 10.1111/j.1939-165x.2006.tb00082.x. Vet Clin Pathol. 2006. PMID: 16511785 Review.
-
Receiver Operating Characteristic (ROC) Curves: The Basics and Beyond.Hosp Pediatr. 2024 Jul 1;14(7):e330-e334. doi: 10.1542/hpeds.2023-007462. Hosp Pediatr. 2024. PMID: 38932727 Review.
Cited by
-
An additive selection of markers to improve diagnostic accuracy based on a discriminatory measure.Acad Radiol. 2013 Jul;20(7):854-62. doi: 10.1016/j.acra.2013.02.009. Epub 2013 Apr 20. Acad Radiol. 2013. PMID: 23611438 Free PMC article.
-
Multivariate normally distributed biomarkers subject to limits of detection and receiver operating characteristic curve inference.Acad Radiol. 2013 Jul;20(7):838-46. doi: 10.1016/j.acra.2013.04.001. Acad Radiol. 2013. PMID: 23747152 Free PMC article.
-
Verification of modified receiver-operating characteristic software using simulated rating data.Radiol Phys Technol. 2018 Dec;11(4):406-414. doi: 10.1007/s12194-018-0479-9. Epub 2018 Sep 22. Radiol Phys Technol. 2018. PMID: 30244314
-
Calibration of medical diagnostic classifier scores to the probability of disease.Stat Methods Med Res. 2018 May;27(5):1394-1409. doi: 10.1177/0962280216661371. Epub 2016 Aug 8. Stat Methods Med Res. 2018. PMID: 27507287 Free PMC article.
-
Tree-structured subgroup analysis of receiver operating characteristic curves for diagnostic tests.Acad Radiol. 2012 Dec;19(12):1529-36. doi: 10.1016/j.acra.2012.09.007. Acad Radiol. 2012. PMID: 23122572 Free PMC article.
References
-
- Wagner RF, Metz CE, Campbell G. Assessment of medical imaging systems and computer aids: a tutorial review. Acad Radiol. 2007;14:723–748. - PubMed
-
- Pepe MS. The statistical evaluation of medical tests for classification and prediction. Oxford University Press; Oxford; New York: 2004.
-
- Zhou X-H, Obuchowski NA, McClish DK. Statistical methods in diagnostic medicine. Wiley-Interscience; New York: 2002.
-
- Diabetes. World Health Organization; [July 14, 2010]. Available from http://www.who.int/topics/diabetes_mellitus/en/
-
- American College of Radiology . Breast imaging reporting and data system (BI-RADS) American College of Radiology; Reston, VA: 2003.
Publication types
MeSH terms
Grants and funding
LinkOut - more resources
Full Text Sources
