. 2012 Jan;52(1):283-91.
doi: 10.1016/j.yjmcc.2011.10.016. Epub 2011 Oct 29.

Epac enhances excitation-transcription coupling in cardiac myocytes

Affiliations

Epac enhances excitation-transcription coupling in cardiac myocytes

Laetitia Pereira et al. J Mol Cell Cardiol. 2012 Jan.

Abstract

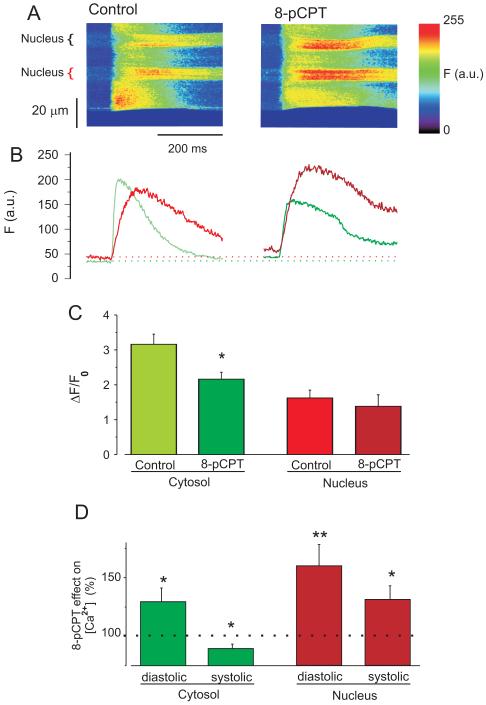
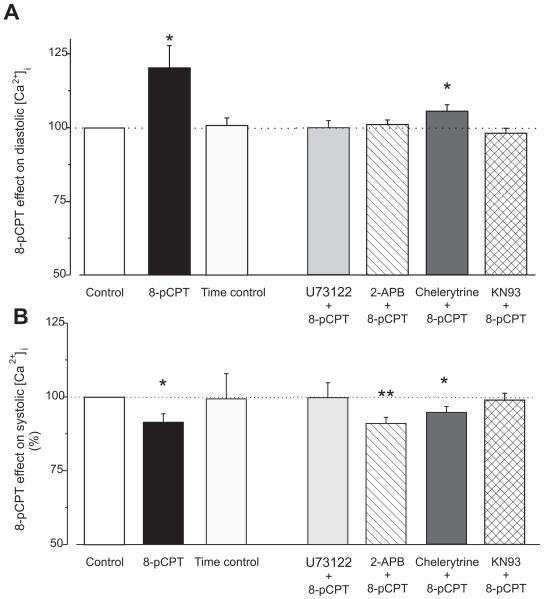
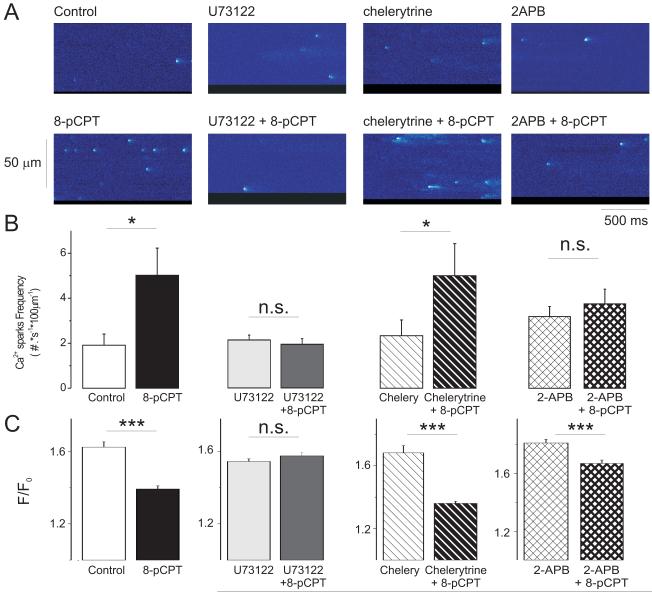
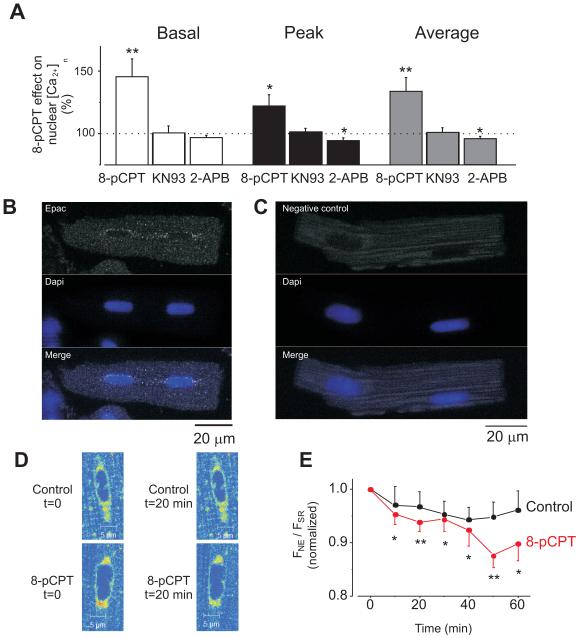
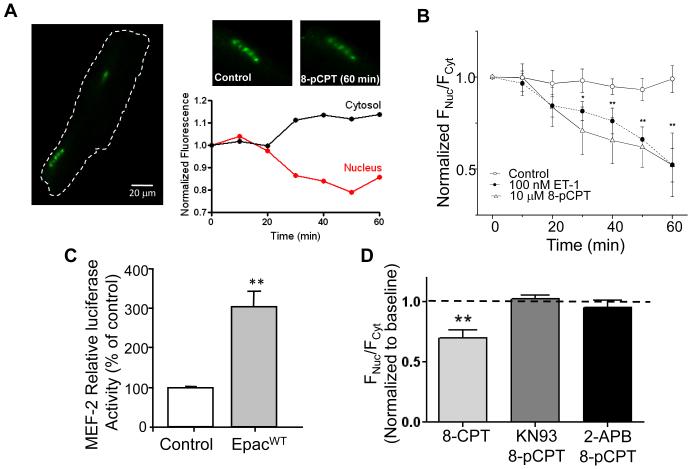
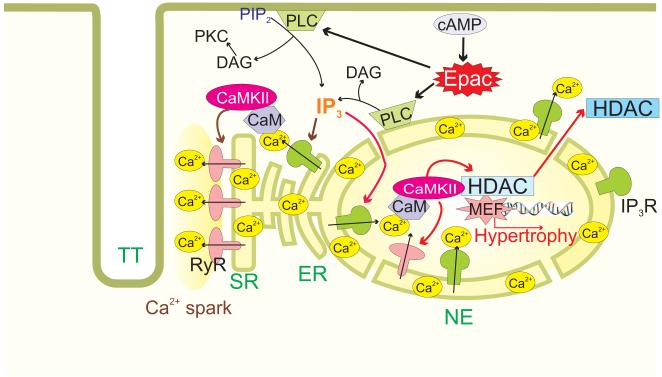
Epac is a guanine nucleotide exchange protein that is directly activated by cAMP, but whose cardiac cellular functions remain unclear. It is important to understand cardiac Epac signaling, because it is activated in parallel to classical cAMP-dependent signaling via protein kinase A. In addition to activating contraction, Ca(2+) is a key cardiac transcription regulator (excitation-transcription coupling). It is unknown how myocyte Ca(2+) signals are decoded in cardiac myocytes to control nuclear transcription. We examine Epac actions on cytosolic ([Ca(2+)](i)) and intranuclear ([Ca(2+)](n)) Ca(2+) homeostasis, focusing on whether Epac alters [Ca(2+)](n) and activates a prohypertrophic program in cardiomyocytes. Adult rat cardiomyocytes, loaded with fluo-3 were viewed by confocal microscopy during electrical field stimulation at 1Hz. Acute Epac activation by 8-pCPT increased Ca(2+) sparks and diastolic [Ca(2+)](i), but decreased systolic [Ca(2+)](i). The effects on diastolic [Ca(2+)](i) and Ca(2+) spark frequency were dependent on phospholipase C (PLC), inositol 1,4,5 triphosphate receptor (IP(3)R) and CaMKII activation. Interestingly, Epac preferentially increased [Ca(2+)](n) during both diastole and systole, correlating with the perinuclear expression pattern of Epac. Moreover, Epac activation induced histone deacetylase 5 (HDAC5) nuclear export, with consequent activation of the prohypertrophic transcription factor MEF2. These data provide the first evidence that the cAMP-binding protein Epac modulates cardiac nuclear Ca(2+) signaling by increasing [Ca(2+)](n) through PLC, IP(3)R and CaMKII activation, and initiates a prohypertrophic program via HDAC5 nuclear export and subsequent activation of the transcription factor MEF2.


Figures

Figure 1
Figure 1. Epac differently modulates intranuclear and cytosolic [Ca2+]
A. Line scan images (including nuclei) of rat ventricular myocytes before (left) and during (right) 10 μM 8-pCPT application during field stimulation at 1 Hz. B. Ca2+ fluorescence (F) traces of the images above. Green is [Ca2+]i and the red is [Ca2+]n. C. [Ca2+] transient amplitudes (ΔF/F0). Green bars are cytosol (n=14) and red bars nucleus (n=13). Lighter colors are control condition, and darker colors are with 8-pCPT. D. 8-pCPT effect on [Ca2+] as percentage of the values before the drug application in cytosol (green bars) and in the nucleus (red bars). *p<0.05, **p<0.01
Figure 2
Figure 2. Epac differently modulates diastolic and systolic [Ca2+]i in the cytosol
A. Epac-induced increase in diastolic [Ca2+]i during field stimulation at 1 Hz. Fluorescence value in each cell during 8-pCPT perfusion was normalized with the value in the same cell before 8-pCPT perfusion. White bar indicate the control in every conditions (n=59), black bar indicates 8-pCPT alone (n=13). Next to the right are time controls (same perfusion time than 8-pCPT but with control solution, n=8). Further to the right, 8-pCPT effect on diastolic [Ca2+]i in the presence of various inhibitors: Light grey bar indicates PLC inhibitor (2 μmol/L U73122, n=9), hatched bar are IP3R blocker by 2 μmol/L 2-APB (n=16), dark are PKC inhibitor 2 μmol/L chelerytrine (n=14), crosshatched are CaMKII inhibitor 1 μmol/L KN93 (n=22). B. The same than in A but for the peak [Ca2+]i fluorescence during the twitch. Bar colors and n numbers as in A. *p<0.05, **p<0.001.
Figure 3
Figure 3. Epac increases Ca2+ sparks frequency by PLC and IP3R activation
A. Line scan images of cardiac myocytes showing Ca2+ sparks in several conditions: From left to right: Control, 2μmol/L U73122 (PLC inhibitor), 2μ mol/L chelerytrine (PKC inhibitor) and 2 μ mol/L 2-APB (IP3R inhibitor). Below each image it is shown another image from each cell, recorded in the presence of 10 μ mol/L 8-pCPT (Epac activator) and in the continuous presence of each inhibitor. B. Bar graph showing the measured Ca2+ spark frequency in: control cells (white bar, n=21) and cells during 8-pCPT alone (black bar, n=14), cells in the presence of the PLC inhibitor U73122 (n=10) before (light grey bar) and during (dark grey bar) 8-pCPT application, cells in the presence of the PKC inhibitor chelerytrine (n=8) before (hatched white bar) and during 8-pCPT application (black hatched bar), and cells in the presence of the IP3R inhibitor 2-APB (n=15) before (cross hatched bar) and during 8-pCPT application (thick crosshatched bar). *p<0.05 with respect to their own control. C. As in B but for the Ca2+ spark amplitudes (peak F/F0). N of Ca2+ sparks was: 201 in control, 251 in 8-pCPT, 207 in U73122, 155 in U73122 + 8pCPT, 228 in chelerytrine, 422 in chelerytrine + 8-pCPT, 298 in 2-APB and 290 in 2-APB + 8pCPT. ***p<0.001
Figure 4
Figure 4. Endogenous Epac preferentially localizes at perinuclear area and its activation induces [Ca2+]n increment via CaMKII and IP3Rs pathways
A. Percentage variations in the [Ca2+]n induced by 10 μmol/L 8-pCPT (n=13) and in the presence of 1 μmol/L KN-93 (CaMKII inhibitor; n=8) or 2 μmol/L 2-APB (IP3R inhibitor; n=13) during constant field stimulation at 1 Hz. Increase in basal Ca2+ fluorescence (during diastolic period) is represented in the white bar, the maximum Ca2+ fluorescence (peak) is represented by the black bar and the average Ca2+ fluorescence (average) is represented by the grey bar. B. Image of a rat ventricular cardiomyocyte immunolabeled with Epac antibody and DAPI to localize the nuclei. Epac fluorescence is shown in the top, nuclei in the middle and merged image in the bottom. C. Negative control: cells were treated as in A but primary antibody was omitted. D. Details of Mag-Fluo-4-AM loaded myocytes to differentially visualize sarcoplasmic reticulum (SR) from nuclear envelope (NE) Ca2+ stores at control conditions (t=0) and following 20 minutes (t=20) of perfusion with control solution (top) or 10 μmol/L 8-pCPT (bottom). E. Averaged traces of nuclear and cytosolic fluorescence (FNE/FSR) in perfused with 10 μmol/L 8-pCPT (red, n=8) and control (black, n=5) myocytes. The afluorescence observed was normalized to the initial FNE/FSR ratio for each cell. *p<0.05, **p<0.01.
Figure 5
Figure 5. Epac activation induces nuclear export of HDAC5 via IP3R and CaMKII
A. Rat ventricular cardiomyocyte expressing the fusion protein HDAC5-GFP before and after 60 minutes 8-pCPT (10 μmol/L) exposure and the corresponding 8-pCPT time-dependent HDAC5-GFP fluorescence changes (normalized to t=0 min) for both cytosol and nucleus B. Time dependence of HDAC5 nuclear export represented as FNuc/FCyto, normalized to the initial ratio. Cells were treated by 10 μmol/L 8-pCPT (open triangles, n=6) or 100 nmol/L Endothelin-1 (black circles, n=4) during 60 minutes. The control group (open circles) was treated the same, except without 8-pCPT or ET-1 application (n=5). C. Neonatal rat ventricular myocytes transfected with either an empty vector (control) or Epac1 (EpacWT) and MEF2-Luc. MEF2-luciferase activity was measured 48h later. Values represent the average of 4 independent experiments performed in triplicates and are normalized to total protein and the relative level of luciferase activity in the control transfected cells was assigned a value of 100. D. Average of nuclear and cytosolic fluorescence ratio (FNuc/FCyto) in presence of 8-pCPT without (light grey bar, n=10) or with KN93 (dark grey bar, n=10) or 2-APB (black bar, n=9) exposure. * p<0.05, **p<0.01.
Figure 6
Figure 6. Proposed scheme of Epac activated hypertrophic signaling in cardiac myocytes
Epac leads to PLC activation and IP3 production. Activation of IP3Rs induces Ca2+ leak from stores, which 1) sensitizes RyRs, 2) activates CaMKII and 3) induces increase in intranuclear Ca2+. The increase in [Ca2+]n and CaMKII activation translocates HDAC out of the nucleus releasing the repression against hypertrophy development.

References

    1. Bers DM. Cardiac excitation-contraction coupling. Nature. 2002;415:198–205. - PubMed
    1. Wu X, Zhang T, Bossuyt J, Li X, McKinsey TA, Dedman JR, et al. Local InsP3-dependent perinuclear Ca2+ signaling in cardiac myocyte excitation-transcription coupling. J Clin Invest. 2006;116:675–82. - PMC - PubMed
    1. Pereira L, Metrich M, Fernandez-Velasco M, Lucas A, Leroy J, Perrier R, et al. The cAMP binding protein Epac modulates Ca2+ sparks by a Ca2+/calmodulin kinase signalling pathway in rat cardiac myocytes. J Physiol. 2007;583:685–94. - PMC - PubMed
    1. Morel E, Marcantoni A, Gastineau M, Birkedal R, Rochais F, Garnier A, et al. cAMP-binding protein Epac induces cardiomyocyte hypertrophy. Circ Res. 2005;97:1296–304. - PubMed
    1. Metrich M, Lucas A, Gastineau M, Samuel JL, Heymes C, Morel E, et al. Epac mediates beta-adrenergic receptor-induced cardiomyocyte hypertrophy. Circ Res. 2008;102:959–65. - PubMed

Publication types

LinkOut - more resources