. 2011 Dec;121(12):4685-99.
doi: 10.1172/JCI45797. Epub 2011 Nov 7.

Crosstalk between the canonical NF-κB and Notch signaling pathways inhibits Pparγ expression and promotes pancreatic cancer progression in mice

Affiliations

Crosstalk between the canonical NF-κB and Notch signaling pathways inhibits Pparγ expression and promotes pancreatic cancer progression in mice

Eleni Maniati et al. J Clin Invest. 2011 Dec.

Abstract

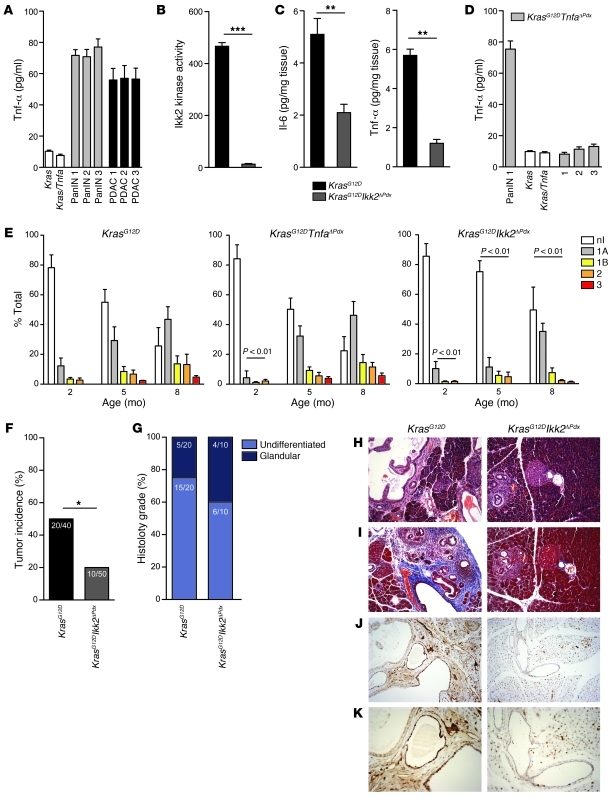
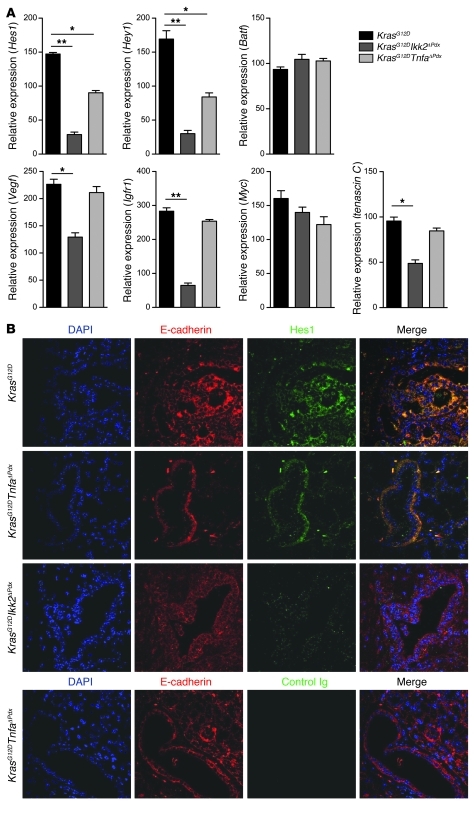
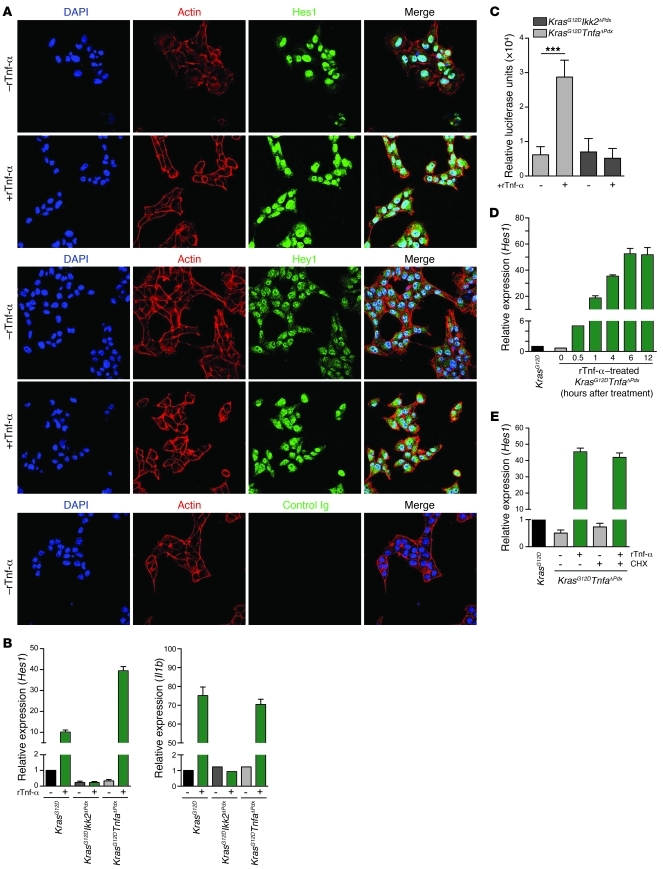
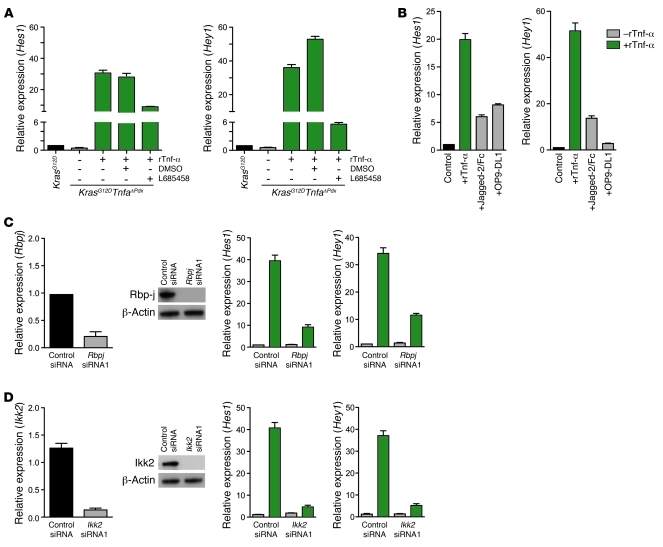
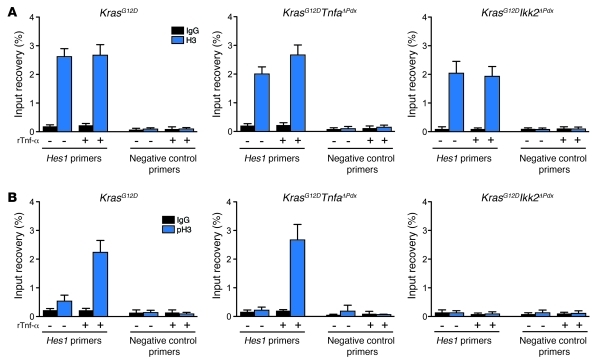
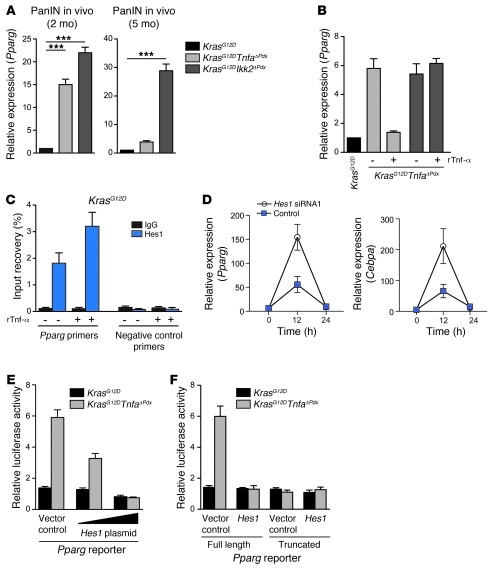
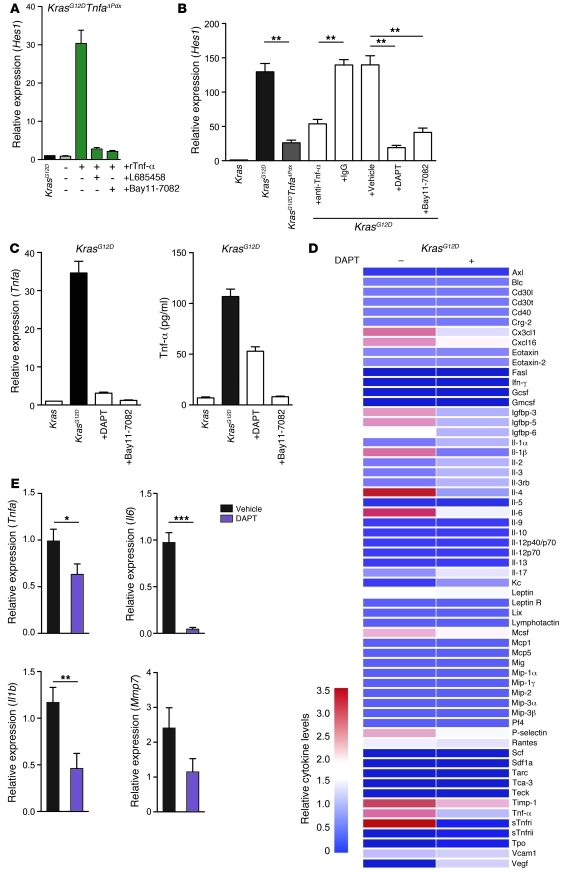
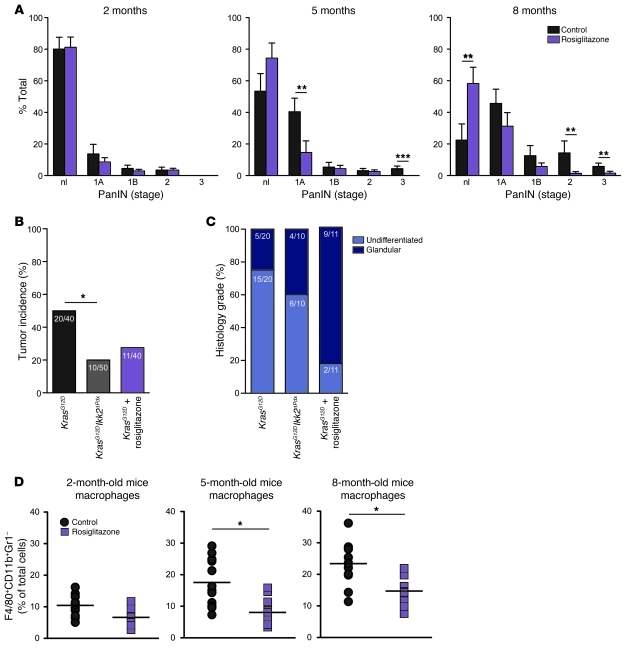
The majority of human pancreatic cancers have activating mutations in the KRAS proto-oncogene. These mutations result in increased activity of the NF-κB pathway and the subsequent constitutive production of proinflammatory cytokines. Here, we show that inhibitor of κB kinase 2 (Ikk2), a component of the canonical NF-κB signaling pathway, synergizes with basal Notch signaling to upregulate transcription of primary Notch target genes, resulting in suppression of antiinflammatory protein expression and promotion of pancreatic carcinogenesis in mice. We found that in the Kras(G12D)Pdx1-cre mouse model of pancreatic cancer, genetic deletion of Ikk2 in initiated pre-malignant epithelial cells substantially delayed pancreatic oncogenesis and resulted in downregulation of the classical Notch target genes Hes1 and Hey1. Tnf-α stimulated canonical NF-κB signaling and, in collaboration with basal Notch signals, induced optimal expression of Notch targets. Mechanistically, Tnf-α stimulation resulted in phosphorylation of histone H3 at the Hes1 promoter, and this signal was lost with Ikk2 deletion. Hes1 suppresses expression of Pparg, which encodes the antiinflammatory nuclear receptor Pparγ. Thus, crosstalk between Tnf-α/Ikk2 and Notch sustains the intrinsic inflammatory profile of transformed cells. These findings reveal what we believe to be a novel interaction between oncogenic inflammation and a major cell fate pathway and show how these pathways can cooperate to promote cancer progression.


Figures

Figure 1
Figure 1. Genetic deletion of Ikk2 inhibits PanIN progression.
(A) Tnf-α secretion by ductal cell lines derived from KrasG12D PanIN- or PDAC-bearing mice measured by ELISA. Control cells were generated from Kras and Kras/Tnfa cre-negative pancreases. (B) Cellular Ikk2 kinase activity in cell lines derived from KrasG12D and KrasG12DIkk2ΔPdx mice. (C) Il-6 and Tnf-α secretion in pancreatic tissue of KrasG12D and KrasG12DIkk2ΔPdx mice. n = 6; **P < 0.01, ***P < 0.01. (D) Tnf-α secretion by cell lines derived from KrasG12D (PanIN 1) or KrasG12DTnfaΔPdx PanIN- or PDAC-bearing mice. Cre-negative Kras and Kras/Tnfa control cells were included. Data in C are shown as mean + SD of n = 6 mice, and data in A, B, and D are mean + SD of triplicate experiments. (E) Quantification of the proportion of pancreas occupied by PanIN lesions. Frequency and grade of the lesions was quantified at 2, 5, and 8 months of age. Data are shown as mean + SD; P < 0.01. nl, no lesion. (F) Tumor incidence and (G) histology grade in KrasG12D and KrasG12DIkk2ΔPdx mice. *P < 0.05. (HK) KrasG12D and KrasG12DIkk2ΔPdx 4-month old pancreases stained with (H) hematoxylin and eosin, (I) Masson’s trichrome (blue, collagen; red, muscle fibers and cytoplasm; black, nuclei) and (J and K) anti-PCNA. Original magnification, ×10 (HJ), ×20 (K).
Figure 2
Figure 2. Molecular analysis of Notch and NF-κB target gene expression in KrasG12DTnfaΔPdx and KrasG12DIkk2ΔPdx pancreases.
(A) Relative mRNA expression of Hes1, Hey1, Batf, Vegf, Igfr1, Myc, and tenascin C in KrasG12DTnfaΔPdx and KrasG12DIkk2ΔPdx 3-month PanIN-bearing pancreases was measured by real-time PCR. Data are shown as mean + SD; n = 6. *P < 0.05, **P < 0.01. The experiment was done in duplicate. (B) Immuno­fluorescence staining for Hes1 and E-cadherin in PanIN-bearing pancreases from KrasG12DTnfaΔPdx, KrasG12DIkk2ΔPdx, and KrasG12D mice at 3 months of age. Original magnification, ×40. Blue, DAPI; red, E-cadherin; green, Hes1.
Figure 3
Figure 3. Tnf-α–induced Notch and NF-κB target gene expression in PanIN cell lines.
(A) Expression of Hes1 and Hey1 in KrasG12D PanIN cell lines was examined by immunofluorescence staining; cells were left unstimulated or were stimulated with 10 ng/ml rTnf-α for 24 hours. Original magnification, ×40. Blue, DAPI; red, actin; green, Hes1. One representative experiment of 3 performed is shown. (B) Relative mRNA expression of Hes1 and Il1b in PanIN cell lines stimulated with 1 ng/ml rTnf-α for 6 hours. Relative expression was calculated by setting expression of untreated KrasG12D samples as 1. (C) Hes1 luciferase reporter assay in KrasG12DTnfaΔPdx and KrasG12DIkk2ΔPdx PanIN cell lines stimulated with 1 ng/ml rTnf-α for 6 hours. Results were normalized to firefly luciferase activity relative to internal control and are expressed as mean + SD from triplicate transfections. ***P < 0.01. One representative experiment of 3 performed is shown. (D) Kinetic analysis of Hes1 mRNA expression in KrasG12DTnfaΔPdx PanIN cell lines stimulated with 1 ng/ml rTnf-α. (E) KrasG12DTnfaΔPdx PanIN cells were treated with 1 ng/ml rTnf-α in the presence or absence of 15 μg/ml cycloheximide (CHX). Expression of Hes1 was quantified by real-time PCR. Relative expression was calculated by setting expression of untreated KrasG12D samples as 1. (B, D, and E) Data are shown as mean + SD of triplicate determinants, and 1 representative experiment of 3 is shown.
Figure 4
Figure 4. Tnf-α–induced Notch target gene expression requires expression of Rbpj and Ikk2.
(A) Inhibition of Hes1 and Hey1 mRNA expression in Tnf-α–induced KrasG12DTnfaΔPdx PanIN cells treated with the γ-secretase inhibitor L685458 (5 μM). Cells were stimulated with 1 ng/ml rTnf-α. (B) KrasG12DTnfaΔPdx PanIN cells were treated with rTnf-α, 20 μg/ml Jagged-2/Fc, or cocultured with OP9-DL1 cells. Tnf-α was more efficient in inducing the expression of Hes1 and Hey1. The results were normalized to values obtained from KrasG12D cells. (C and D) KrasG12DTnfaΔPdx PanIN cell lines transfected with (C) Rbpj- or (D) Ikk2-specific siRNA. Forty-eight hours after transfection, cells were stimulated with 1 ng/ml rTnf-α for 6 hours, and expression of Hes1 was quantified by real-time PCR. Nontargeting siRNA and/or unstimulated controls were included. Results were normalized to uninfected and unstimulated KrasG12DTnfaΔPdx cells. All data are shown as mean + SD of triplicate determinants and are representative of 3 independent experiments.
Figure 5
Figure 5. Tnf-α–induced Notch target gene expression is dependent on Ikk2 and chromatin remodeling.
ChIP was performed on rTnf-α–treated KrasG12D, KrasG12DTnfaΔPdx, and KrasG12DIkk2ΔPdx samples with anti–histone H3 (A) or anti–phospho–histone H3 at serine 10 (pH3) (B). Rabbit IgG was used as control. Precipitated DNA was measured by real-time PCR using primers specific for Hes1. Results are shown as mean + SD of triplicate determinants and are representative of 3 independent experiments.
Figure 6
Figure 6. Tnf-α/NF-κB and Notch crosstalk leads to Hes1-mediated Pparg inhibition.
(A) Pparg mRNA expression in 2- and 5-month-old KrasG12DTnfaΔPdx and KrasG12DIkk2ΔPdx pancreases. Data were normalized to KrasG12D pancreases. Data are shown as mean + SD; n = 6. ***P < 0.001. The experiment was performed in duplicate. (B) Tnf-α stimulation (1 ng/ml) induced downregulation of Pparg in KrasG12DTnfaΔPdx PanIN cell lines. (C) ChIP was performed on KrasG12D cells using anti-Hes1 or a control IgG. Precipitated DNA was amplified by real-time PCR using primers specific for Pparg. (D) siRNA knockdown of Hes1 upregulated Pparg and Cebpa expression in KrasG12D PanIN cells. (E) KrasG12D and KrasG12DTnfaΔPdx PanIN cells were cotransfected in duplicate with a Pparg reporter construct containing 1,500 bases of the proximal Pparg promoter (full length) and a Hes1 expression plasmid or empty vector control. Twenty-four hours after transfection, cells were analyzed for luciferase activity. (F) Transfection of KrasG12DTnfaΔPdx PanIN cells as described in E with a full-length Pparg reporter construct or a construct with a truncated Hes1-binding sequence. All data are shown as mean + SD from duplicate transfections and are representative of 3 independent experiments.
Figure 7
Figure 7. Inhibition of Notch/NF-κB signaling attenuates the inflammatory profile of malignant cells.
(A) KrasG12DTnfaΔPdx cells were stimulated with 1 ng/ml rTnf-α for 6 hours in the presence or absence of L685458 or Bay11-7082. Hes1 mRNA expression was quantified by real-time PCR. Results were normalized to unstimulated KrasG12D cells. Data are shown as mean + SD of triplicate determinants and are representative of 3 independent experiments. (B) Hes1 mRNA expression in pancreases of 5-month-old untreated KrasG12D and KrasG12DIkk2ΔPdx mice and of KrasG12D mice treated with anti–Tnf-α, control IgG, DAPT, Bay11-7082, or the vehicle control. Results were normalized to Kras pancreases. Data are shown as mean + SD; n = 6. **P < 0.01. The experiment was done in duplicate. (C) KrasG12D PanIN cells were treated with DAPT or Bay11-7082. Tnfa mRNA expression and cytokine secretion are indicated. Data are shown as mean + SD of triplicate experiments and are representative of 3 independent experiments. (D) Cytokine and chemokine array on whole pancreases of DAPT or vehicle-treated 5-month-old KrasG12D mice. The data are represented graphically as normalized signal intensity. (E) Tnfa, Il6, Il1b, and Mmp7 expression in FACS-sorted EYFP-positive KrasG12D cells treated for 1 week with DAPT or vehicle. Data are shown as mean + SD; n = 12. *P < 0.05, **P < 0.01, ***P < 0.001. Analysis of Mmp7 expression did not reveal statistical significance.
Figure 8
Figure 8. Rosiglitazone treatment blocks PanIN progression in KrasG12D mice.
(A) Quantification of the percentage or pancreatic parenchyma occupied by PanINs in KrasG12D mice treated with rosiglitazone compared with untreated controls. Values are shown as mean + SD; n = 12. (B) Tumor incidence and (C) histology grade in rosiglitazone-treated KrasG12D mice compared with untreated KrasG12D and KrasG12DIkk2ΔPdx mice. (D) Percentage of F4/80+CD11b+Gr1 cells in the pancreas of 2-, 5-, and 8-month-old KrasG12D mice treated with rosiglitazone or untreated as measured by flow cytometry. Each data point represents an individual mouse. Mean values are depicted by the horizontal lines; n = 10. *P < 0.05, **P < 0.01, ***P < 0.001.

References

    1. Mantovani A, Allavena P, Sica A, Balkwill F. Cancer-related inflammation. Nature. 2008;454(7203):436–444. - PubMed
    1. Downward J. Targeting RAS signalling pathways in cancer therapy. Nat Rev Cancer. 2003;3(1):11–22. doi: 10.1038/nrc969. - DOI - PubMed
    1. Jaffee EM, Hruban RH, Canto M, Kern SE. Focus on pancreas cancer. Cancer Cell. 2002;2(1):25–28. doi: 10.1016/S1535-6108(02)00093-4. - DOI - PubMed
    1. Hruban RH, et al. Pancreatic intraepithelial neoplasia: a new nomenclature and classification system for pancreatic duct lesions. Am J Surg Pathol. 2001;25(5):579–586. doi: 10.1097/00000478-200105000-00003. - DOI - PubMed
    1. Hingorani SR, et al. Preinvasive and invasive ductal pancreatic cancer and its early detection in the mouse. Cancer Cell. 2003;4(6):437–450. doi: 10.1016/S1535-6108(03)00309-X. - DOI - PubMed

Publication types

MeSH terms