. 2012 Jan 5;422(1):114-24.
doi: 10.1016/j.virol.2011.10.012. Epub 2011 Nov 5.

Primary human cervical carcinoma cells require human papillomavirus E6 and E7 expression for ongoing proliferation

Affiliations

Primary human cervical carcinoma cells require human papillomavirus E6 and E7 expression for ongoing proliferation

Thomas G Magaldi et al. Virology. .

Abstract

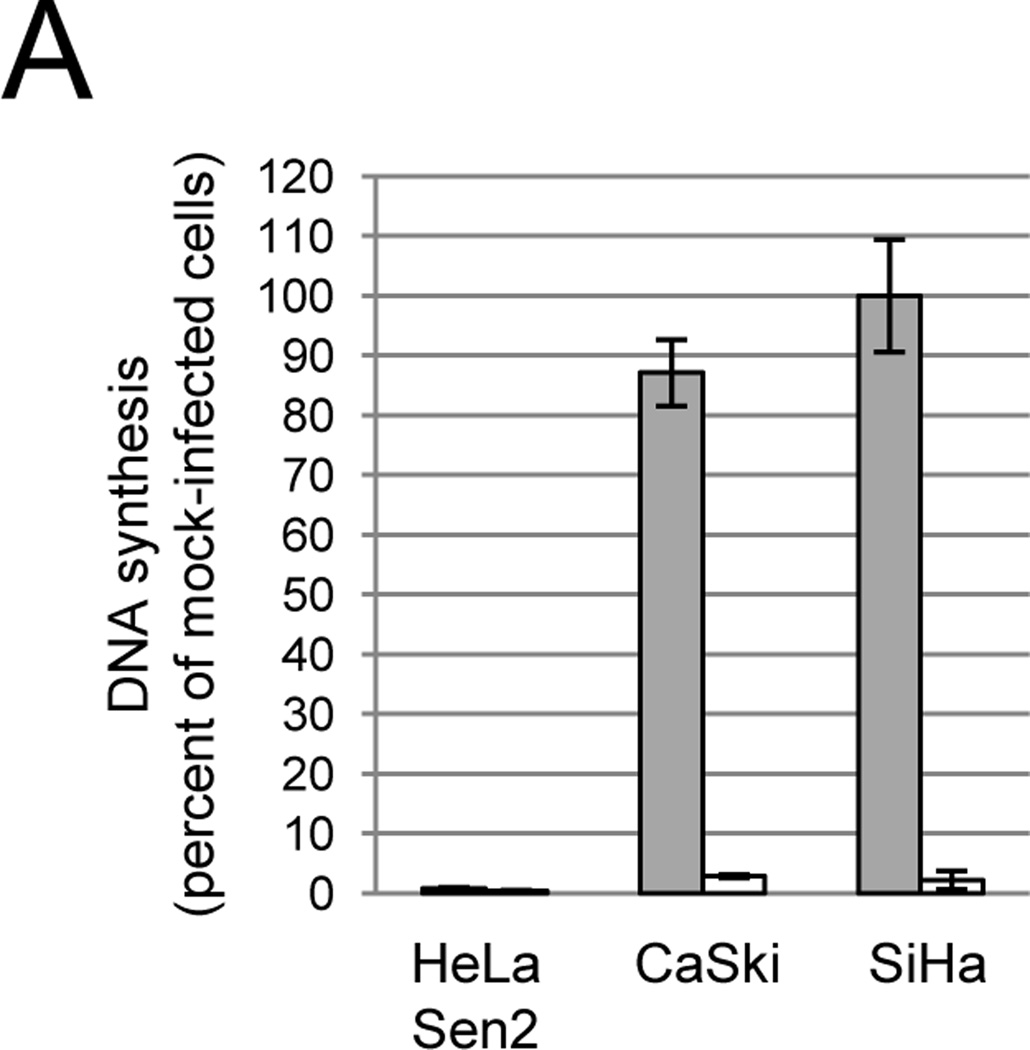
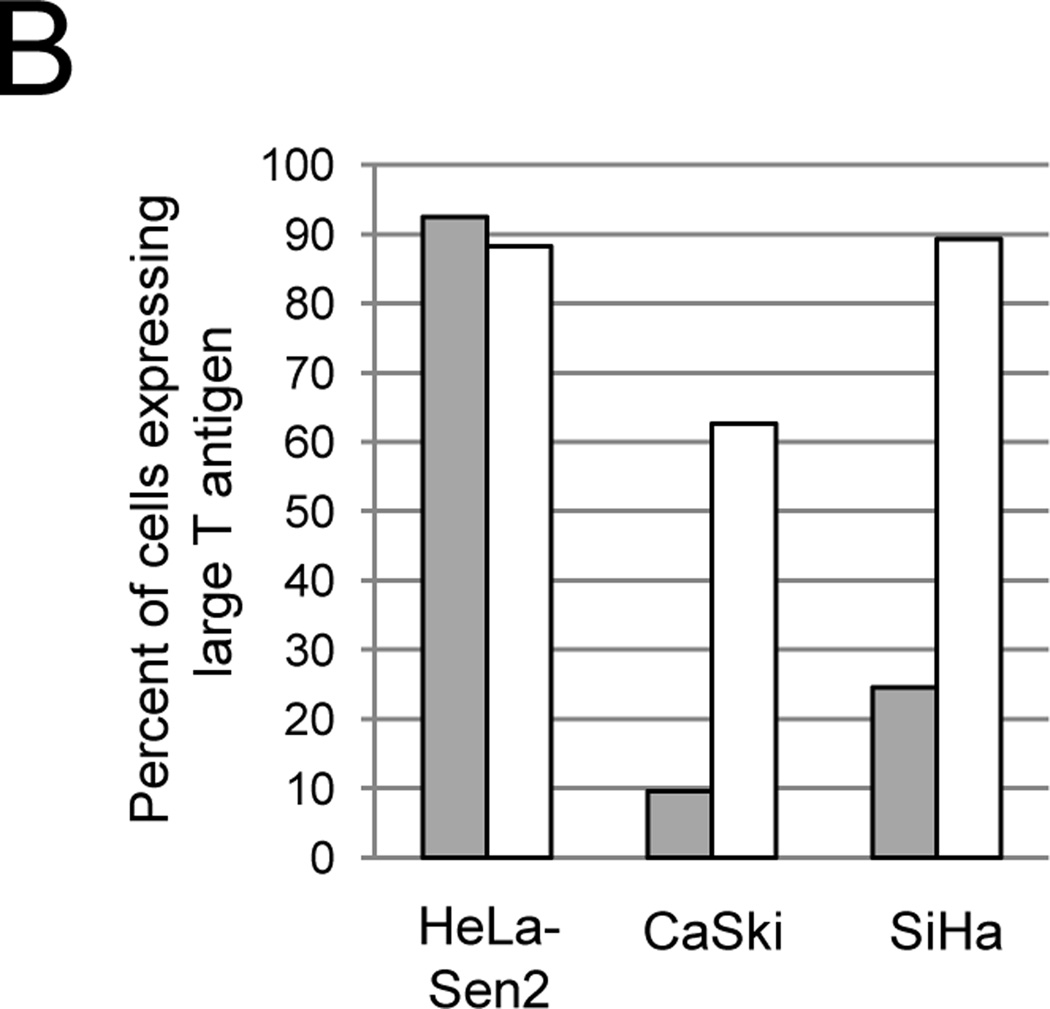
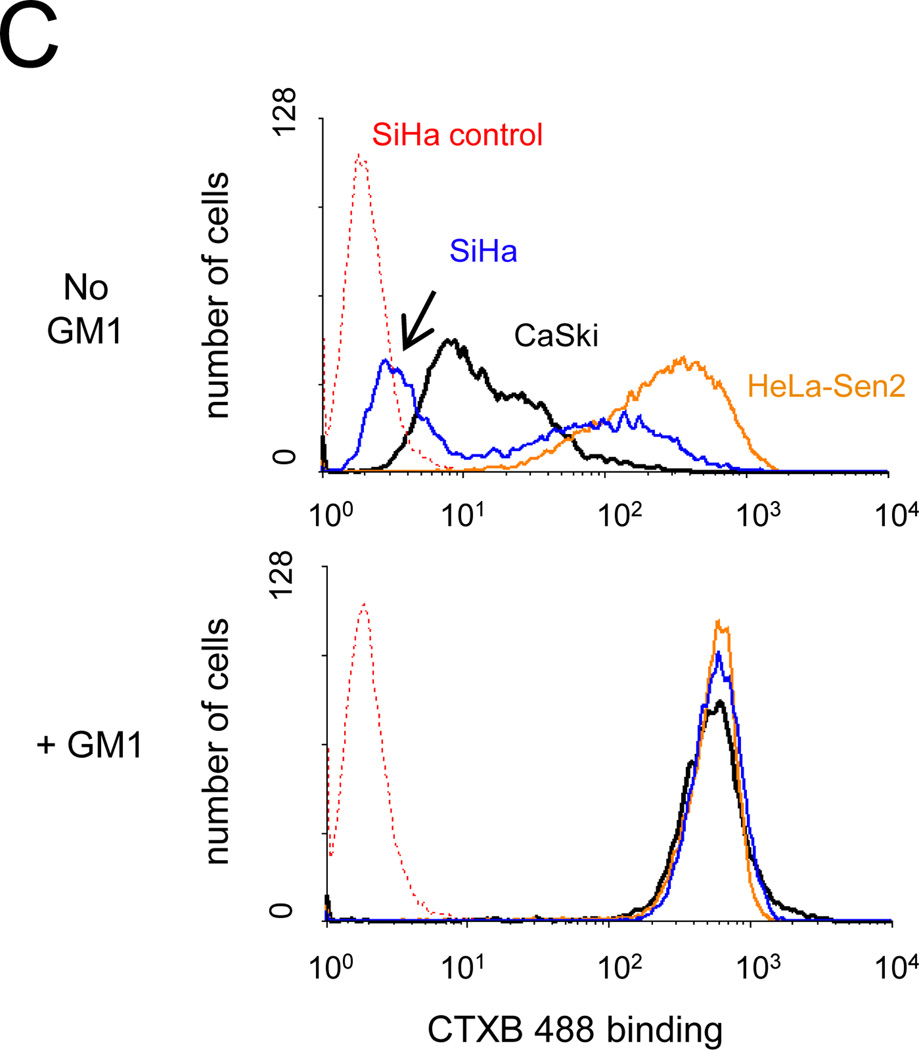
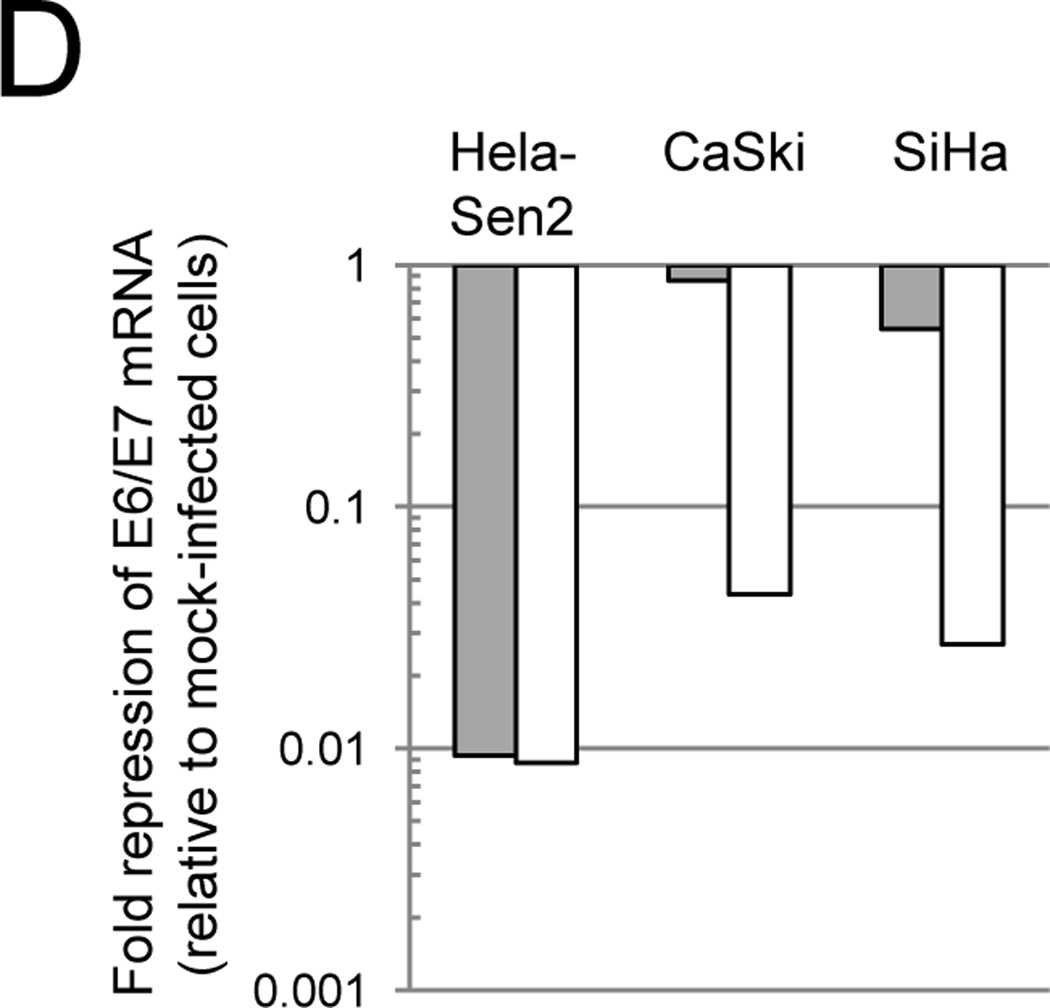
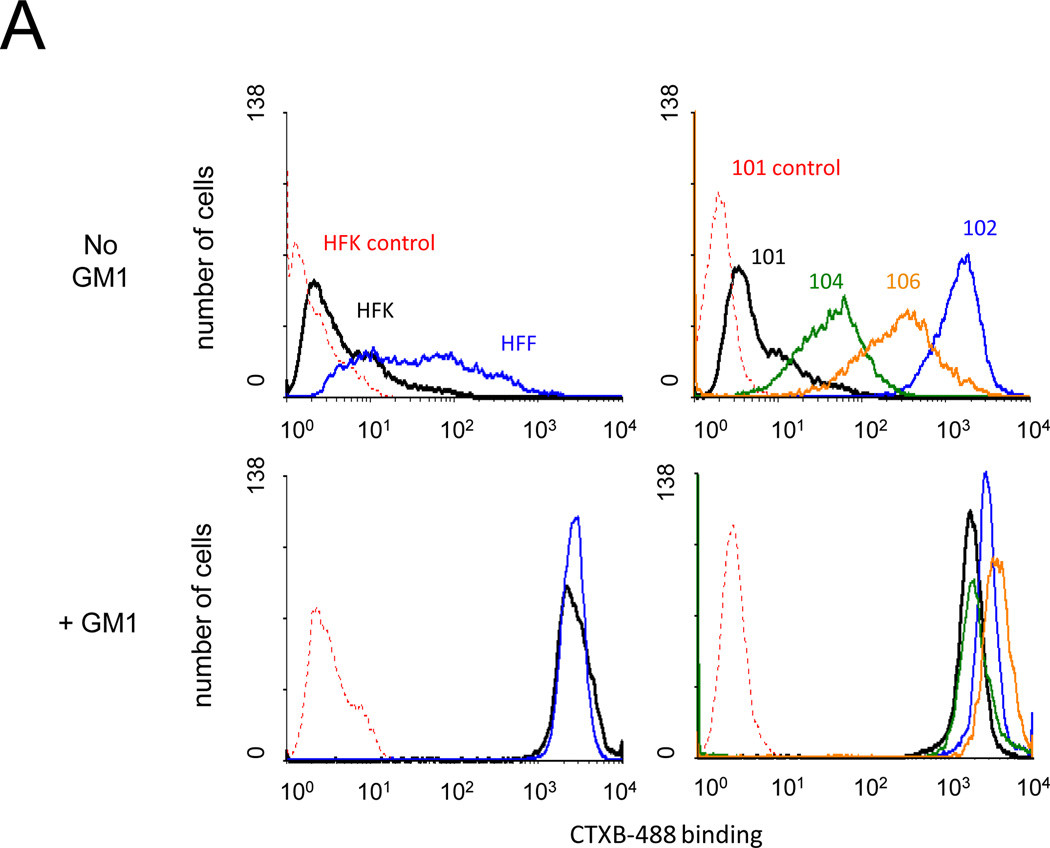
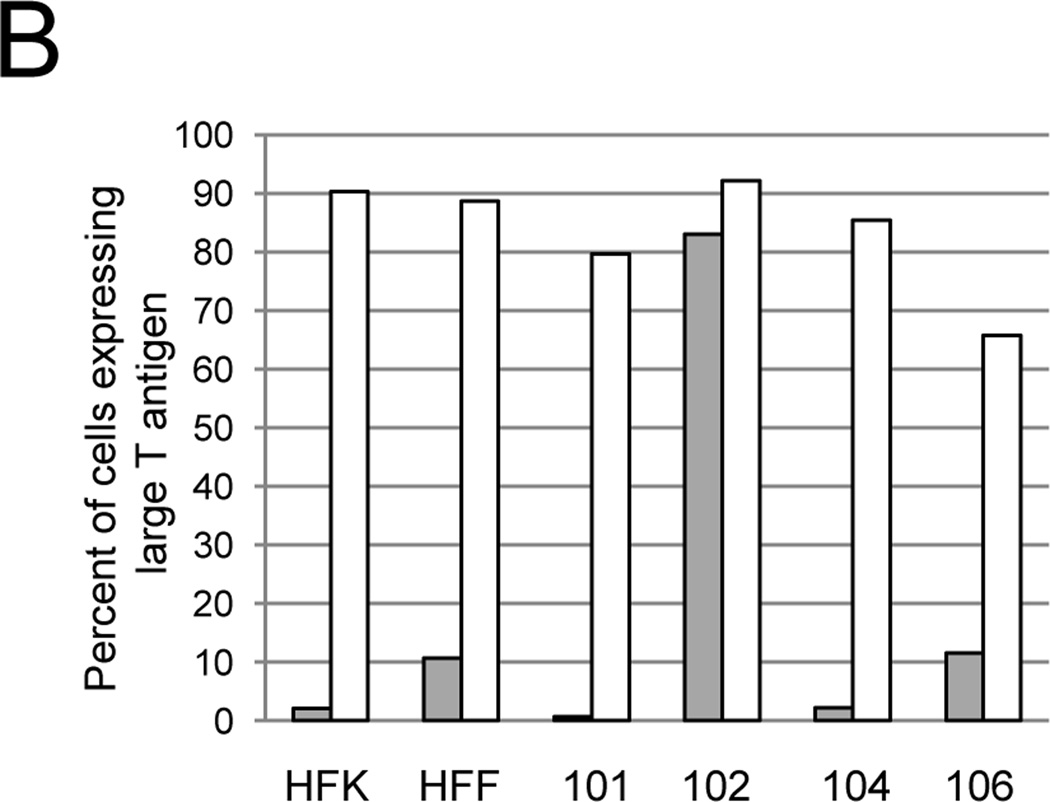
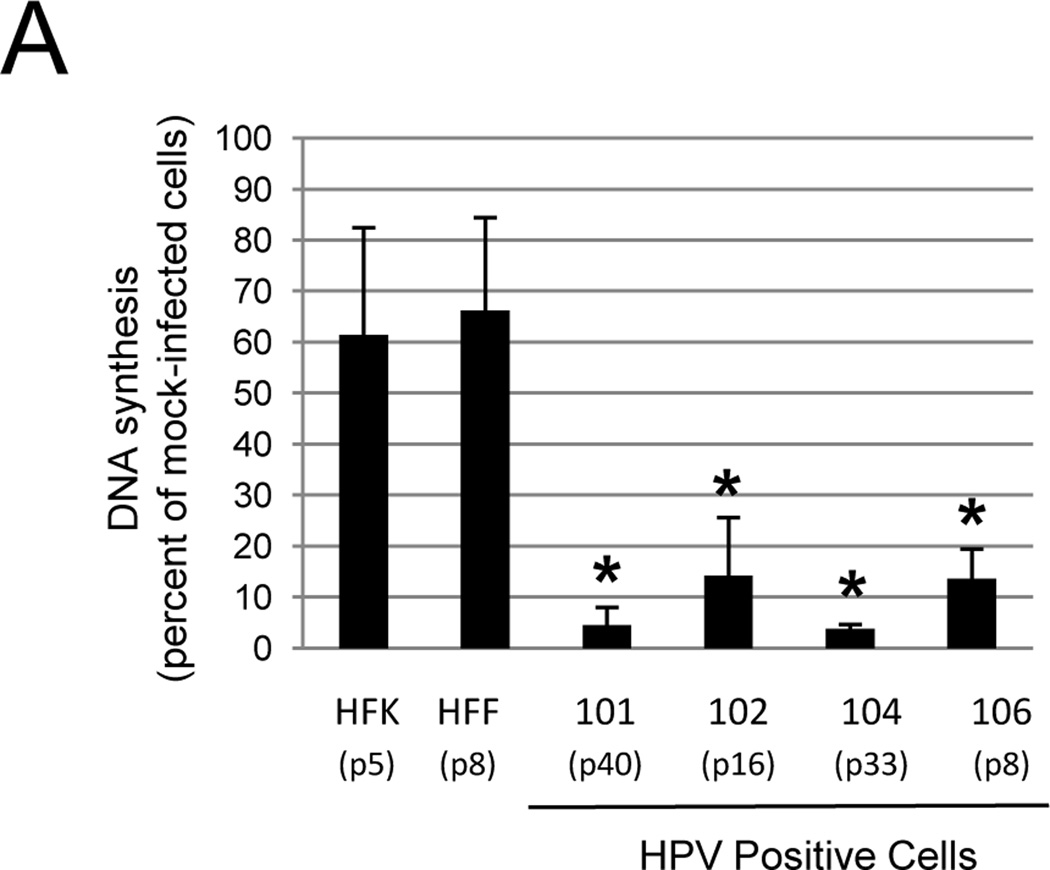
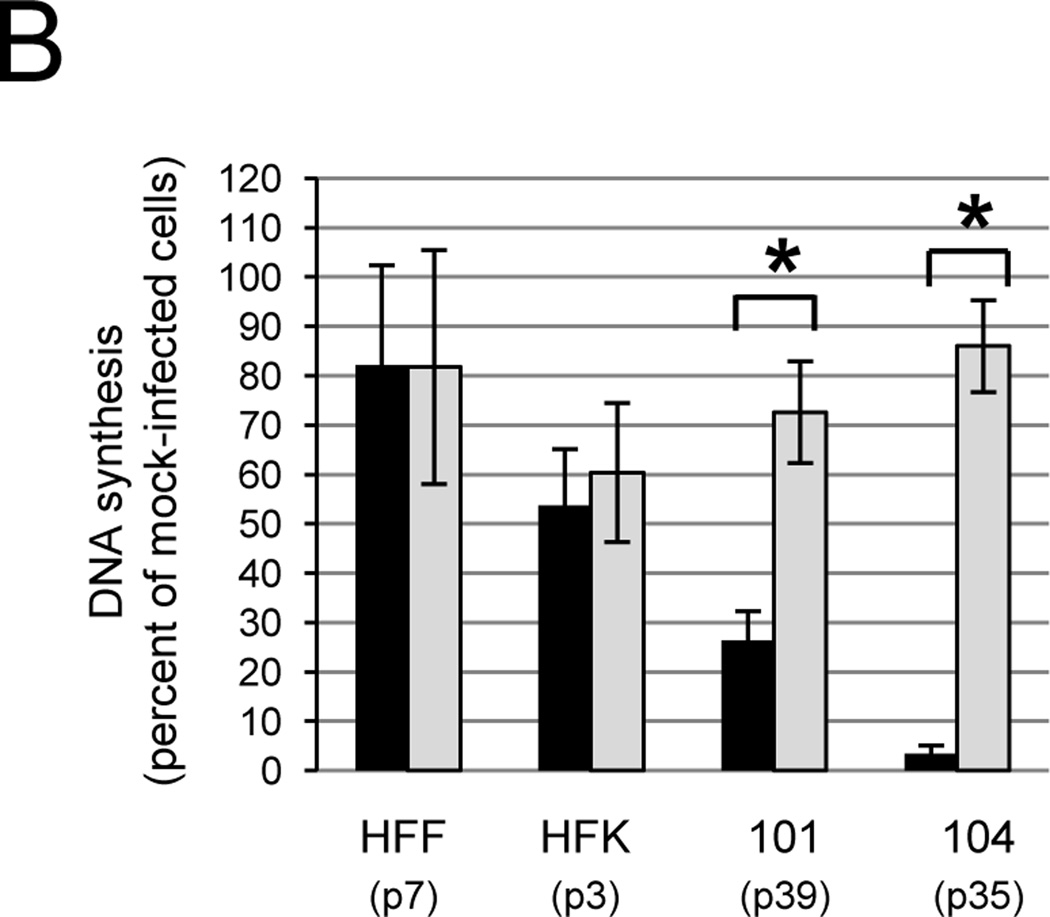
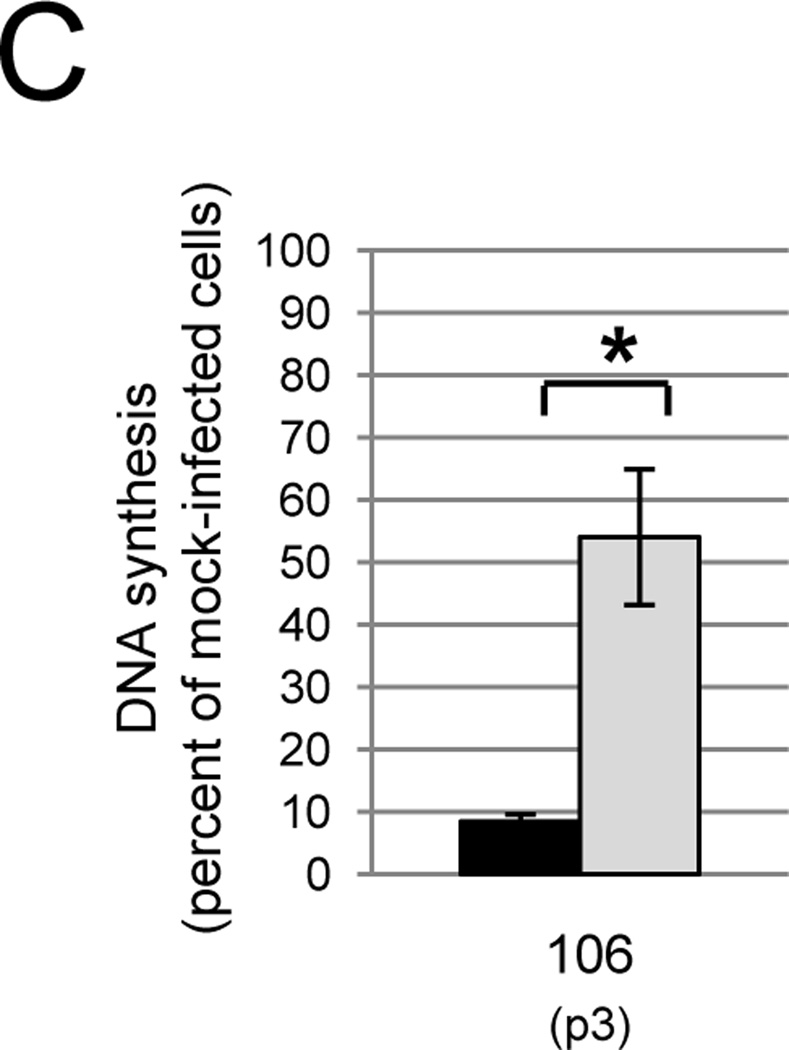
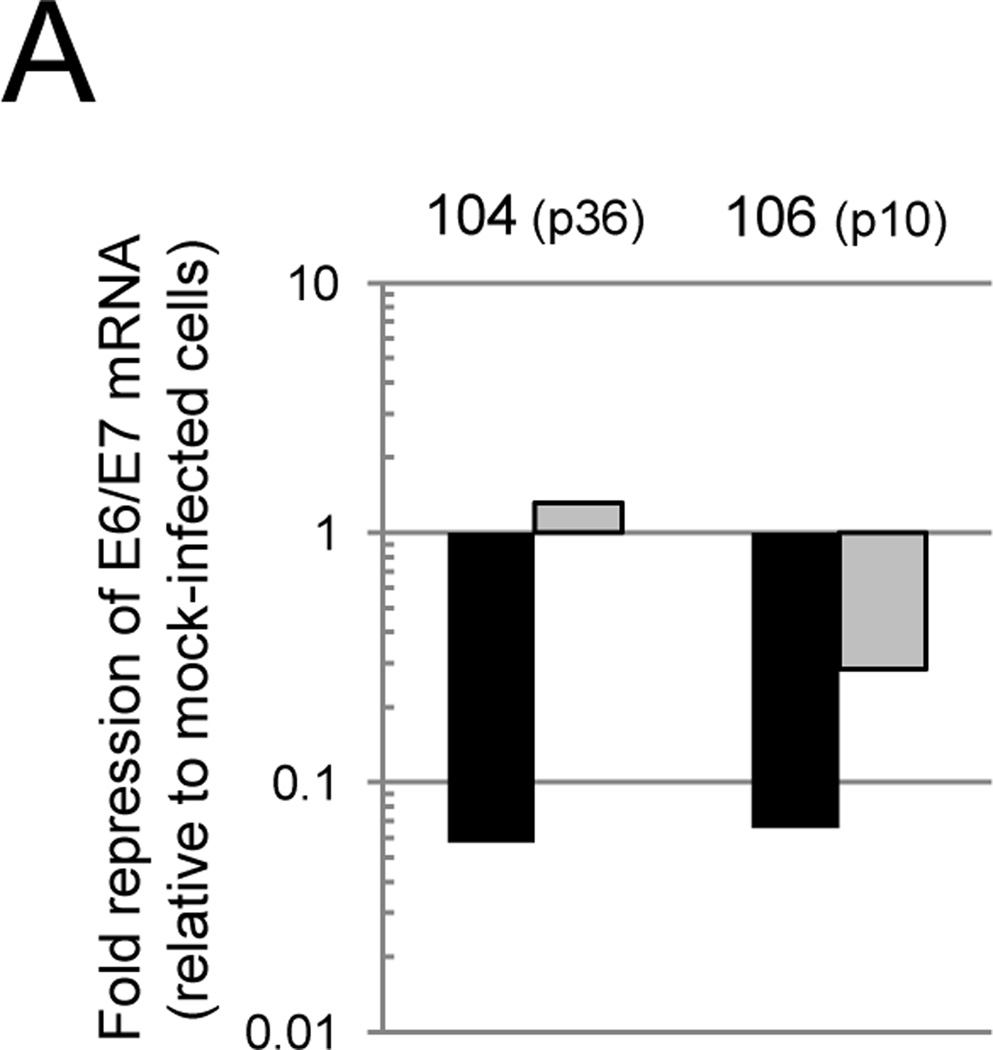
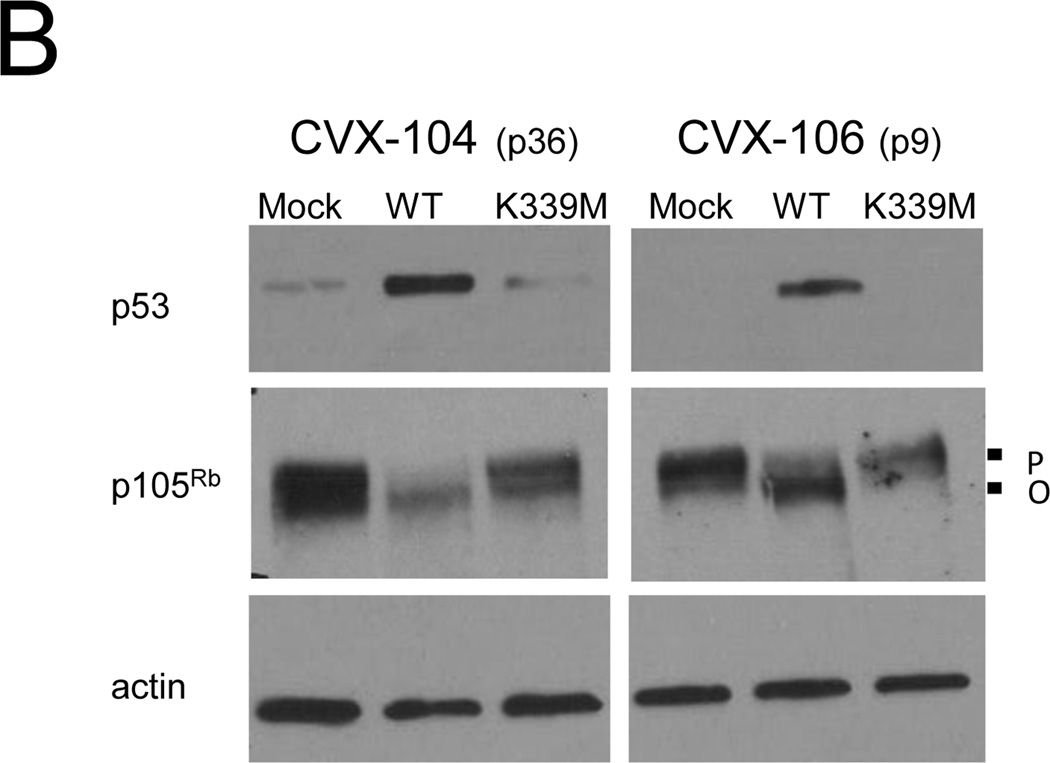
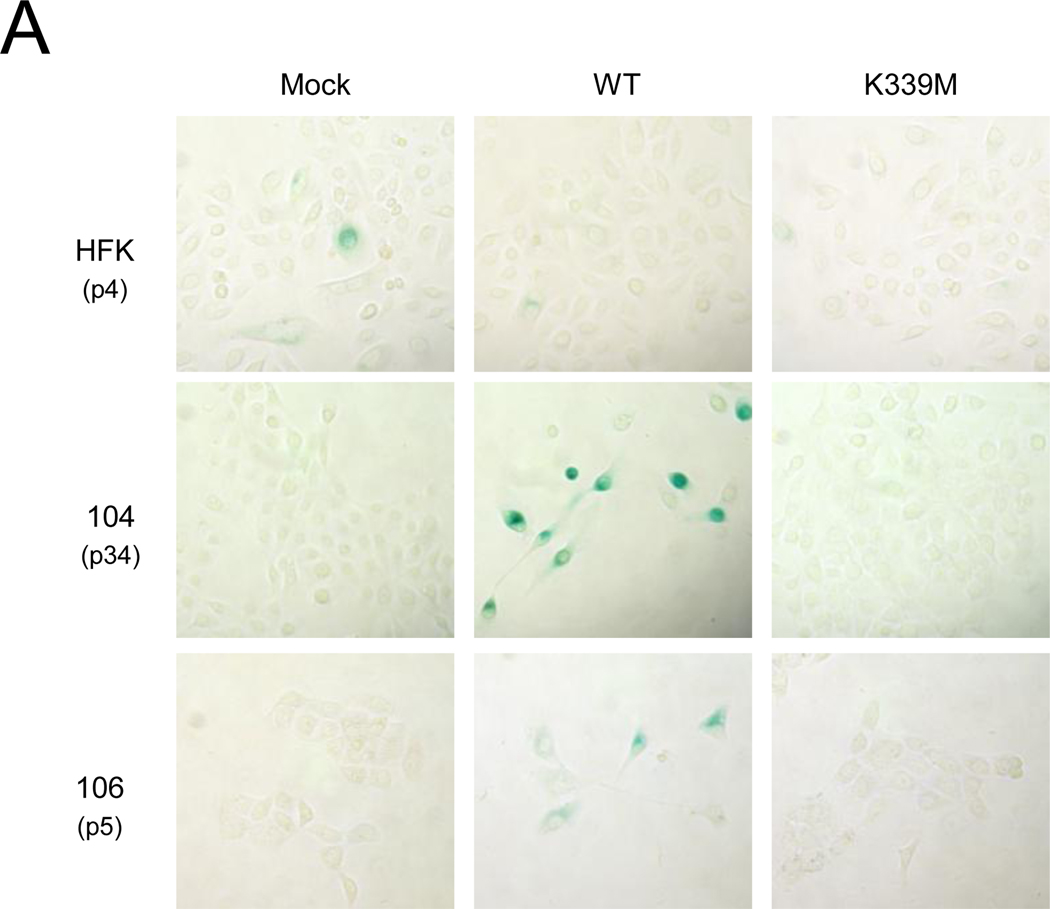
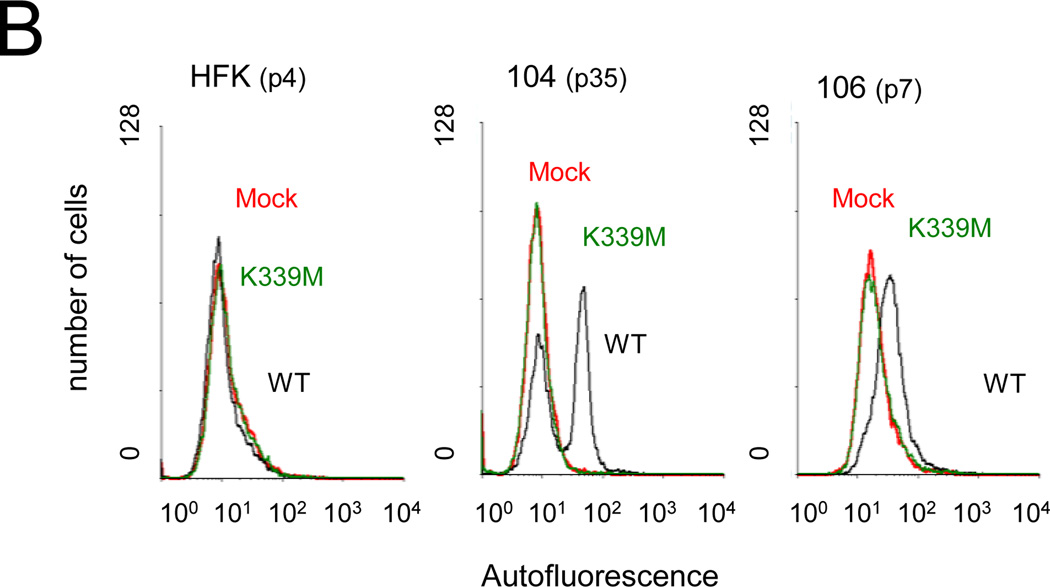
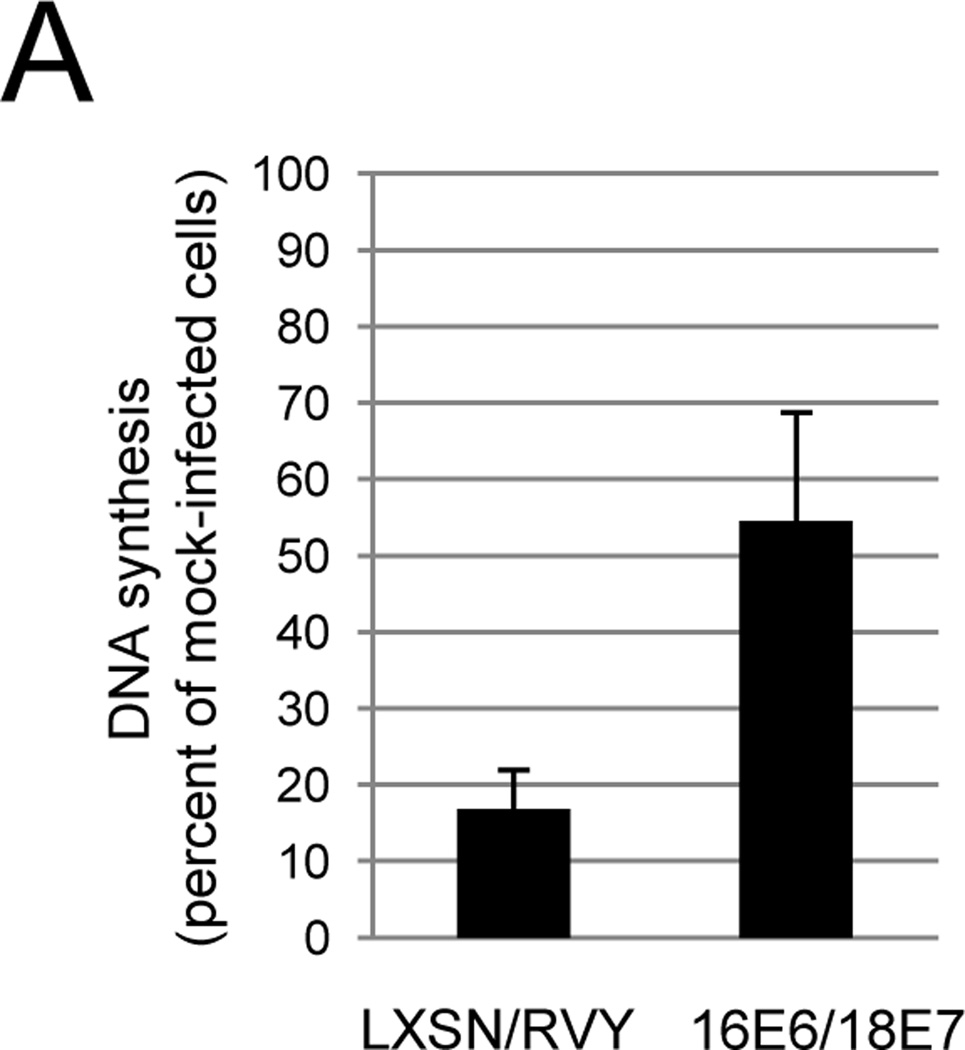
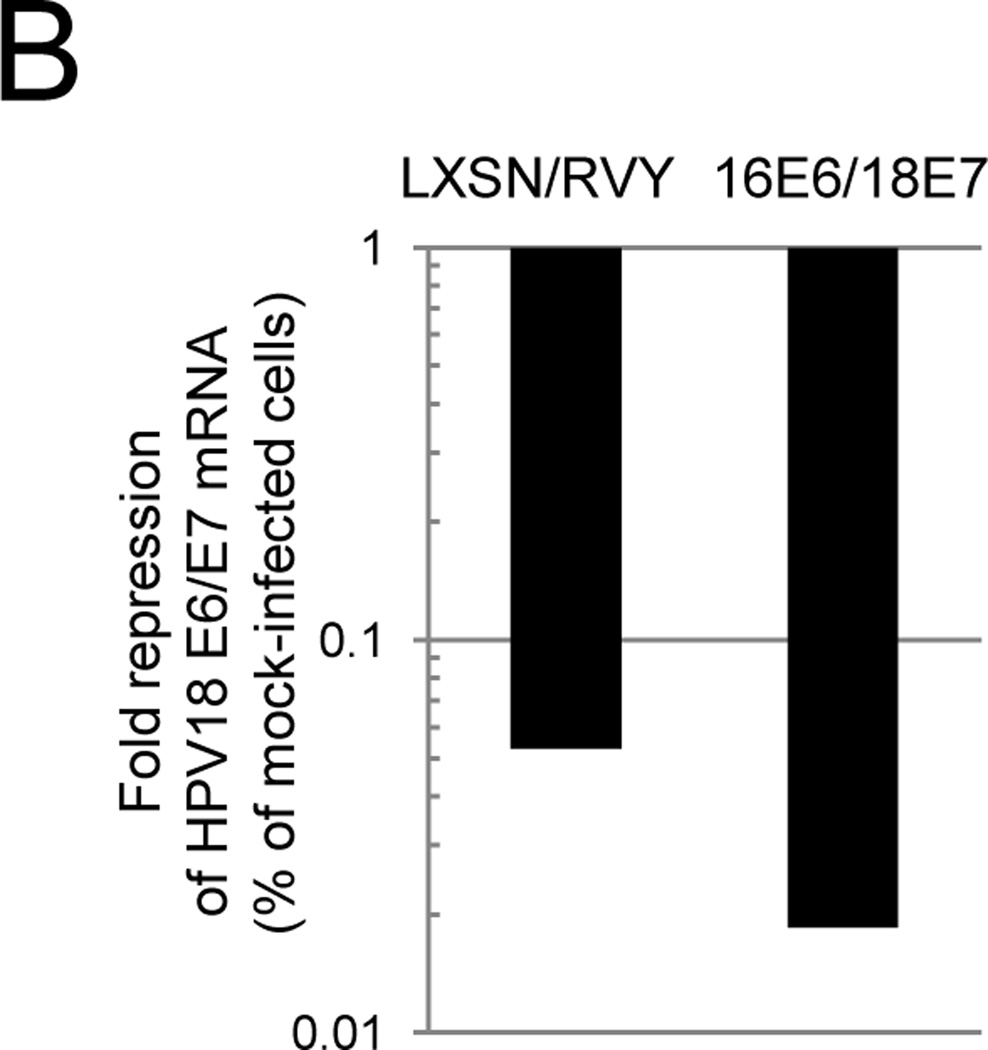
Repression of human papillomavirus (HPV) E6 and E7 oncogenes in established cervical carcinoma cell lines causes senescence due to reactivation of cellular tumor suppressor pathways. Here, we determined whether ongoing expression of HPV16 or HPV18 oncogenes is required for the proliferation of primary human cervical carcinoma cells in serum-free conditions at low passage number after isolation from patients. We used an SV40 viral vector expressing the bovine papillomavirus E2 protein to repress E6 and E7 in these cells. To enable efficient SV40 infection and E2 gene delivery, we first incubated the primary cervical cancer cells with the ganglioside GM1, a cell-surface receptor for SV40 that is limiting in these cells. Repression of HPV in primary cervical carcinoma cells caused them to undergo senescence, but the E2 protein had little effect on HPV-negative primary cells. These data suggest that E6 and E7 dependence is an inherent property of human cervical cancer cells.


Figures

Fig. 1
Fig. 1
Effect of GM1 on SV40 infection of cervical carcinoma cell lines. A) Cells were left untreated (grey bars) or treated with GM1 overnight (white bars) and then either mock-infected or infected with Pava at an MOI of 20. At 48 hrs post-infection, DNA synthesis was measured by incorporation of tritiated thymidine and is presented as the percent of tritiated thymidine incorporation in infected cells relative to mock-infected cells. The results of a typical experiment are presented, and represent the average of triplicate samples. Similar results were obtained in at least three independent experiments. B) Cells were left untreated (grey bars) or treated with GM1 overnight (white bars) and infected with SV40 at an MOI of 10. The fraction of cells expressing large T antigen was measured by immunostaining and flow cytometry at 48 hrs post-infection. Similar results were obtained in three independent experiments. C) Cells were left untreated (top panel) or treated with GM1 overnight (bottom panel), and GM1 surface levels were measured by flow cytometry of binding of fluorescently-labeled CTXB. The dotted red lines represent SiHa cells incubated in the absence of CTXB. Similar results were obtained in at least three independent experiments. D) Cells were left untreated (grey bars) or treated with GM1 overnight (white bars), and either mock-infected or infected with Pava at an MOI of 20. At 48 hrs post-infection, HPV18 E6/E7 mRNA levels in HeLa-Sen2 cells and HPV16 E6/E7 mRNA levels in SiHa and CaSki cells were measured by qRT-PCR and normalized to GAPDH mRNA levels. E7 expression is reported as fold-reduction in the level of mRNA in infected cells relative to mock-infected cells. The results of a typical experiment are presented, and represent the average of triplicate samples. Similar results were obtained in two independent experiments.
Fig. 1
Fig. 1
Effect of GM1 on SV40 infection of cervical carcinoma cell lines. A) Cells were left untreated (grey bars) or treated with GM1 overnight (white bars) and then either mock-infected or infected with Pava at an MOI of 20. At 48 hrs post-infection, DNA synthesis was measured by incorporation of tritiated thymidine and is presented as the percent of tritiated thymidine incorporation in infected cells relative to mock-infected cells. The results of a typical experiment are presented, and represent the average of triplicate samples. Similar results were obtained in at least three independent experiments. B) Cells were left untreated (grey bars) or treated with GM1 overnight (white bars) and infected with SV40 at an MOI of 10. The fraction of cells expressing large T antigen was measured by immunostaining and flow cytometry at 48 hrs post-infection. Similar results were obtained in three independent experiments. C) Cells were left untreated (top panel) or treated with GM1 overnight (bottom panel), and GM1 surface levels were measured by flow cytometry of binding of fluorescently-labeled CTXB. The dotted red lines represent SiHa cells incubated in the absence of CTXB. Similar results were obtained in at least three independent experiments. D) Cells were left untreated (grey bars) or treated with GM1 overnight (white bars), and either mock-infected or infected with Pava at an MOI of 20. At 48 hrs post-infection, HPV18 E6/E7 mRNA levels in HeLa-Sen2 cells and HPV16 E6/E7 mRNA levels in SiHa and CaSki cells were measured by qRT-PCR and normalized to GAPDH mRNA levels. E7 expression is reported as fold-reduction in the level of mRNA in infected cells relative to mock-infected cells. The results of a typical experiment are presented, and represent the average of triplicate samples. Similar results were obtained in two independent experiments.
Fig. 2
Fig. 2
Effect of GM1 on SV40 infection of primary cervical carcinoma cells. A) The indicated cells were left untreated (top panels) or treated with GM1 overnight (bottom panels), and GM1 surface expression was measured by flow cytometry of binding of fluorescently-labeled CTXB. Dotted red lines represent fluorescence of HFK (left panels) or CVX-101 cells (right panels) incubated in the absence of CTXB. Similar results were obtained in two independent experiments. B) The indicated cell strains were left untreated (grey bars) or treated with GM1 overnight (white bars) and infected with SV40 at an MOI of 10. The fraction of cells expressing large T antigen was measured as is described in Figure 1B. Similar results were obtained in two independent experiments.
Fig. 2
Fig. 2
Effect of GM1 on SV40 infection of primary cervical carcinoma cells. A) The indicated cells were left untreated (top panels) or treated with GM1 overnight (bottom panels), and GM1 surface expression was measured by flow cytometry of binding of fluorescently-labeled CTXB. Dotted red lines represent fluorescence of HFK (left panels) or CVX-101 cells (right panels) incubated in the absence of CTXB. Similar results were obtained in two independent experiments. B) The indicated cell strains were left untreated (grey bars) or treated with GM1 overnight (white bars) and infected with SV40 at an MOI of 10. The fraction of cells expressing large T antigen was measured as is described in Figure 1B. Similar results were obtained in two independent experiments.
Fig. 3
Fig. 3
The WT E2 protein inhibits DNA synthesis in primary carcinoma cells. A) The indicated cell strains were treated with GM1 overnight and either mock-infected or infected with Pava at an MOI of 10. DNA synthesis was measured as in Figure 1A and is presented as the percent of tritiated thymidine incorporated in infected cells relative to mock-infected cells. The numbers in parentheses indicate the passage at which the cells were tested. The results of a typical experiment are shown, and represent the average of triplicate samples. Asterisks indicate a significant difference between DNA synthesis of mock and infected cells (*p <.05). Similar results were obtained in at least four independent experiments. B) Cells were treated with GM1 in panel A and infected with Pava encoding WT (black bars) or K339M (grey bars) E2 at an MOI of 10. DNA synthesis was measured and is presented as in panel A. The brackets indicate a significant difference between DNA synthesis of cells infected with WT or K339M-E2 (* p<.005). Similar results were obtained in at least four independent experiments. C) Cells were treated with GM1 and infected with WT or mutant Pava as in panel A. DNA synthesis was measured 72 hrs post-infection and is presented as in panel A. The brackets indicate a significant difference between DNA synthesis of cells infected with WT or K339M E2 (* p <.02). Similar results were obtained in two independent experiments.
Fig. 3
Fig. 3
The WT E2 protein inhibits DNA synthesis in primary carcinoma cells. A) The indicated cell strains were treated with GM1 overnight and either mock-infected or infected with Pava at an MOI of 10. DNA synthesis was measured as in Figure 1A and is presented as the percent of tritiated thymidine incorporated in infected cells relative to mock-infected cells. The numbers in parentheses indicate the passage at which the cells were tested. The results of a typical experiment are shown, and represent the average of triplicate samples. Asterisks indicate a significant difference between DNA synthesis of mock and infected cells (*p <.05). Similar results were obtained in at least four independent experiments. B) Cells were treated with GM1 in panel A and infected with Pava encoding WT (black bars) or K339M (grey bars) E2 at an MOI of 10. DNA synthesis was measured and is presented as in panel A. The brackets indicate a significant difference between DNA synthesis of cells infected with WT or K339M-E2 (* p<.005). Similar results were obtained in at least four independent experiments. C) Cells were treated with GM1 and infected with WT or mutant Pava as in panel A. DNA synthesis was measured 72 hrs post-infection and is presented as in panel A. The brackets indicate a significant difference between DNA synthesis of cells infected with WT or K339M E2 (* p <.02). Similar results were obtained in two independent experiments.
Fig. 4
Fig. 4
The WT E2 protein represses E6 and E7 and activates p53 and p105Rb in primary cervical carcinoma cells. A) Cells were treated with GM1 and either mock-infected or infected with Pava encoding WT (black bars) or K339M (grey bars) E2 at an MOI of 10. At 40 hrs post-infection, levels of HPV18 E6/E7 (CVX-104) and HPV16 E6/E7 (CVX-106) mRNA were measured and reported as described in Figure 1D. The passage numbers at which the cells were tested are indicated in parentheses. Similar results were obtained in three independent experiments. B) Cells were treated with GM1 and either mock-infected or infected as in panel A. Protein was harvested at 48 hrs post-infection and analyzed by SDS-PAGE and immunoblotting for p105Rb, p53, and actin (loading control). P indicates hyperphosphorylated p105Rb, while O indicates active, hypophosphorylated p105Rb. Similar results were obtained in three independent experiments.
Fig. 4
Fig. 4
The WT E2 protein represses E6 and E7 and activates p53 and p105Rb in primary cervical carcinoma cells. A) Cells were treated with GM1 and either mock-infected or infected with Pava encoding WT (black bars) or K339M (grey bars) E2 at an MOI of 10. At 40 hrs post-infection, levels of HPV18 E6/E7 (CVX-104) and HPV16 E6/E7 (CVX-106) mRNA were measured and reported as described in Figure 1D. The passage numbers at which the cells were tested are indicated in parentheses. Similar results were obtained in three independent experiments. B) Cells were treated with GM1 and either mock-infected or infected as in panel A. Protein was harvested at 48 hrs post-infection and analyzed by SDS-PAGE and immunoblotting for p105Rb, p53, and actin (loading control). P indicates hyperphosphorylated p105Rb, while O indicates active, hypophosphorylated p105Rb. Similar results were obtained in three independent experiments.
Fig. 5
Fig. 5
Repression of E6 and E7 induces senescence in primary cervical carcinoma cells. A) HFK, CVX-104, and CVX-106 cells at the indicated passage number were twice treated with GM1 and infected with Pava encoding WT or K339M E2 at an MOI of 10. At nine days post-infection, cells were fixed and stained for SA-β-galactosidase activity. Similar results were obtained for each cell type in at least two independent experiments. B) Cells were infected as in panel A. Autofluorescence was measured by flow cytometry at day seven post-infection. Similar results were obtained in three independent experiments. Red, mock-infected; black, WT E2; green, K339M E2.
Fig. 5
Fig. 5
Repression of E6 and E7 induces senescence in primary cervical carcinoma cells. A) HFK, CVX-104, and CVX-106 cells at the indicated passage number were twice treated with GM1 and infected with Pava encoding WT or K339M E2 at an MOI of 10. At nine days post-infection, cells were fixed and stained for SA-β-galactosidase activity. Similar results were obtained for each cell type in at least two independent experiments. B) Cells were infected as in panel A. Autofluorescence was measured by flow cytometry at day seven post-infection. Similar results were obtained in three independent experiments. Red, mock-infected; black, WT E2; green, K339M E2.
Fig. 6
Fig. 6
Growth inhibition of primary cervical carcinoma cells is dependent upon repression of E6 and E7. A) CVX-104 cells infected with either empty retroviral vectors (LXSN/RVY) or vectors encoding E2-resistant HPV16 E6 and HPV18 E7 genes (16E6/18E7) were treated with GM1 and either mock-infected or infected with Pava as described in Figure 3A. DNA synthesis was measured as in Figure 3A and is presented as the average of three independent experiments. The difference between DNA synthesis of infected LXSN/RVY cells as a % of mock-infected cells and 16E6/18E7 infected cells as a % of mock-infected cells was statistically significant (* p <.05). B) Vector only or 16E6/18E7-expressing CVX-104 cells were treated with GM1 and infected with Pava as described in Figure 4A. Endogenous HPV18 E6 mRNA levels were measured by qRT-PCR as described in Figure 4A. Similar results were obtained in two independent experiments.
Fig. 6
Fig. 6
Growth inhibition of primary cervical carcinoma cells is dependent upon repression of E6 and E7. A) CVX-104 cells infected with either empty retroviral vectors (LXSN/RVY) or vectors encoding E2-resistant HPV16 E6 and HPV18 E7 genes (16E6/18E7) were treated with GM1 and either mock-infected or infected with Pava as described in Figure 3A. DNA synthesis was measured as in Figure 3A and is presented as the average of three independent experiments. The difference between DNA synthesis of infected LXSN/RVY cells as a % of mock-infected cells and 16E6/18E7 infected cells as a % of mock-infected cells was statistically significant (* p <.05). B) Vector only or 16E6/18E7-expressing CVX-104 cells were treated with GM1 and infected with Pava as described in Figure 4A. Endogenous HPV18 E6 mRNA levels were measured by qRT-PCR as described in Figure 4A. Similar results were obtained in two independent experiments.

References

    1. Arbeit JM, Howley PM, Hanahan D. Chronic estrogen-induced cervical and vaginal squamous carcinogenesis in human papillomavirus type 16 transgenic mice. Proc Natl Acad Sci U S A. 1996;93(7):2930–2935. - PMC - PubMed
    1. Baker CC, Phelps WC, Lindgren V, Braun MJ, Gonda MA, Howley PM. Structural and transcriptional analysis of human papillomavirus type 16 sequences in cervical carcinoma cell lines. J Virol. 1987;61(4):962–971. - PMC - PubMed
    1. Balmain A, Harris CC. Carcinogenesis in mouse and human cells: parallels and paradoxes. Carcinogenesis. 2000;21(3):371–377. - PubMed
    1. Bignotti E, Tassi RA, Calza S, Ravaggi A, Romani C, Rossi E, Falchetti M, Odicino FE, Pecorelli S, Santin AD. Differential gene expression profiles between tumor biopsies and short-term primary cultures of ovarian serous carcinomas: identification of novel molecular biomarkers for early diagnosis and therapy. Gynecol Oncol. 2006;103(2):405–416. - PubMed
    1. Bosch FX, Lorincz A, Munoz N, Meijer CJ, Shah KV. The causal relation between human papillomavirus and cervical cancer. J Clin Pathol. 2002;55(4):244–265. - PMC - PubMed

Publication types

MeSH terms

Substances