. 2011 Nov 1;25(21):2242-7.
doi: 10.1101/gad.177220.111.

Splitting the task: Ubp8 and Ubp10 deubiquitinate different cellular pools of H2BK123

Affiliations

Splitting the task: Ubp8 and Ubp10 deubiquitinate different cellular pools of H2BK123

Julia M Schulze et al. Genes Dev. .

Abstract

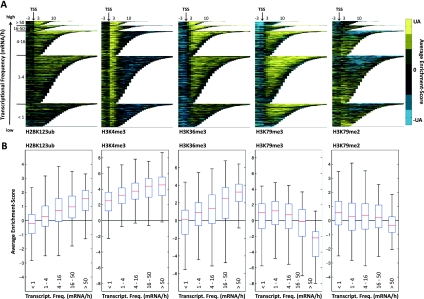
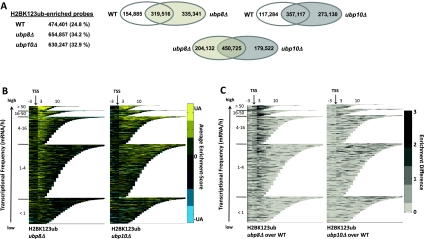
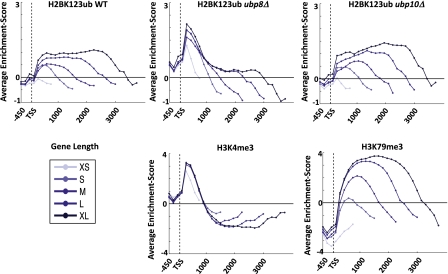
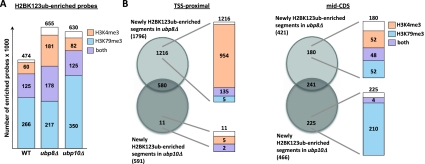
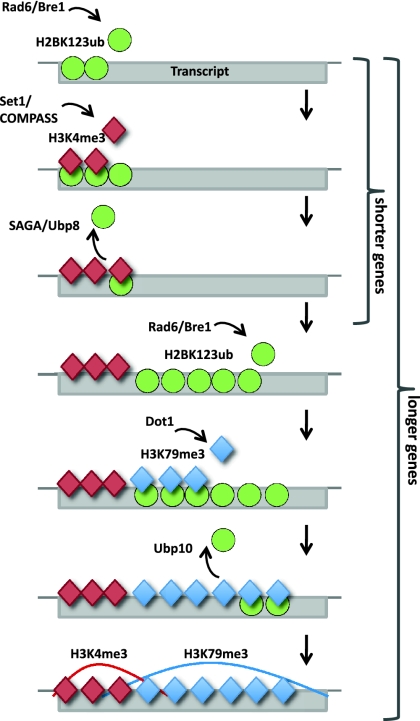
Monoubiquitination of H2BK123 (H2BK123ub), catalyzed by Rad6/Bre1, is a transient histone modification with roles in transcription and is essential for establishing H3K4 and H3K79 trimethylations (H3K4me3 and H3K79me3). Here, we investigated the chromatin network around H2BK123ub by examining its localization and co-occurrence with its dependent marks as well as the transcription elongation mark H3K36me3 across the genome of Saccharomyces cerevisiae. In yeast, H2BK123ub is removed by the deubiquitinases Ubp8 and Ubp10, but their genomic target regions remain to be determined. Genome-wide maps of H2BK123ub in the absence of Ubp8 and Ubp10 revealed their distinct target loci, which were genomic sites enriched for H3K4me3 and H3K79me3, respectively. We propose an extended model of the H2BK123ub cross-talk by integrating existing relationships with the substrate specificities of Ubp8 and Ubp10 reported here.


Figures

Figure 1.
Figure 1.
Association of H2BK123ub and H3 methylation marks with transcriptional frequency. (A) Enrichment of H2BK123ub, H3K4me3, H3K36me3, H3K79me3, and H3K79me2 across all transcripts sorted by their length and transcriptional frequency and aligned by their TSSs. The normalized ChIP-on-chip model-based analysis of tiling arrays (MAT) scores were binned into segments of 150 base pairs (bp), and the average enrichment value for each bin was color-coded and plotted. The upper adjacent (UA) of the MAT score distribution was used for color bar limits. Transcripts were grouped into five classes according to their number of transcripts per hour (Holstege et al. 1998) (Transcriptome 2005, http://web.wi.mit.edu/young/pub/holstege.html). (B) Box plots indicating the association of histone marks with transcriptional frequencies. As in A, transcripts were grouped into five classes according to their transcriptional frequency. For all modifications and each transcript, the average enrichment score was calculated as the average MAT score of all probes between transcript start and end. For each transcription class, the average scores were plotted as standard box plots (see the Materials and Methods). For H3K4me3, which peaks downstream from the TSSs around the +2 and +3 nucleosome, average scores were calculated for 300 bp in that region.
Figure 2.
Figure 2.
Site-specific removal of H2BK123 ubiquitin by Ubp8 and Ubp10. (A) Number of probes enriched for H2BK123ub within transcripts in wild-type as well as ubp8 and ubp10 deletion strains. Venn diagrams comparing the overlap of these probes between the different strains. (B) Distribution of H2BK123ub in wild-type as well as ubp8 and ubp10 deletion strains across all transcripts, sorted by their transcriptional frequencies. Calculations and plotting as in Figure 1A. (C) Differences in the enrichment of H2BK123ub in ubp8 and ubp10 deletion strains. Enrichment scores for H2BK123ub in ubp8 and ubp10 deletion strains were subtracted from wild-type enrichment scores and only positive-definite results were color-coded. Average enrichment was calculated and transcripts were sorted as in Figure 1A.
Figure 3.
Figure 3.
H2BK123ub profiles in ubp8 and ubp10 deletion strains resembled H3K4me3 and H3K79me3 profiles, respectively. All genes with known TSSs were divided into five length classes, and the average enrichment for H2BK123ub wild-type and ubp8 and ubp10 deletion strains as well as H3K4me3 and H3K79me3 were plotted in 150-bp increments. The H2BK123ub profiles in the ubp8Δ and ubp10Δ strains resembled the averaged profiles of H3K4me3 and H3K79me3, respectively.
Figure 4.
Figure 4.
Ubp8 removed H2BK123ub at sites enriched for H3K4me3, whereas Ubp10 acted on H3K79me3-marked regions. (A) All probes enriched for H2BK123ub within transcripts in wild-type as well as ubp8 and ubp10 deletion strains were compared with the number of these probes enriched for H3K4me3 and H3K79me3. (B) Venn diagrams comparing the number of TSS-proximal and mid-CDS segments newly enriched for H2BK123ub in ubp8 and ubp10 deletion strains. Circles represent the overlap of segments newly enriched for H2BK123ub in ubp8 or ubp10 deletion strains. Bars indicate segments marked by H3K4me3 (light red), H3K79me3 (light blue), or both (purple).
Figure 5.
Figure 5.
Model depicting the circuitry of H2BK123ub and its dependent marks, H3K4me3 and H3K79me3, in short and long genes. In the 5′ end of short and long genes, H2B is monoubiquitinated by Rad6/Bre1, resulting in the recruitment of Set1/COMPASS to trimethylate H3K4me3 (Shilatifard 2006). After H3K4me3 is established, Ubp8 removes H2BK123ub. In longer genes, depending on an extensive elongation phase, H2B is monoubiquitinated in the body of transcripts, which recruits Dot1 to trimethylate H3K79me3. In these regions, H2BK123ub is removed by Ubp10.

References

    1. Batta K, Zhang Z, Yen K, Goffman DB, Pugh BF 2011. Genome-wide function of H2B ubiquitylation in promoter and genic regions. Genes Dev (this issue). doi: 10.1101/gad.177238.111 - PMC - PubMed
    1. D'Andrea AD. 2010. Susceptibility pathways in Fanconi's anemia and breast cancer. N Engl J Med 362: 1909–1919 - PMC - PubMed
    1. Daniel JA, Torok MS, Sun Z-W, Schieltz D, Allis CD, Yates JR, Grant PA 2004. Deubiquitination of histone H2B by a yeast acetyltransferase complex regulates transcription. J Biol Chem 279: 1867–1871 - PubMed
    1. Dover J, Schneider J, Tawiah-Boateng M, Wood A, Dean K, Johnston M, Shilatifard A 2002. Methylation of histone H3 by COMPASS requires ubiquitination of histone H2B by Rad6. J Biol Chem 277: 28368–28371 - PubMed
    1. Droit A, Cheung C, Gottardo R 2010. rMAT—an R/Bioconductor package for analyzing ChIP–chip experiments. Bioinformatics 26: 678–679 - PubMed

Publication types

MeSH terms