. 2011 Nov 6;8(12):1027-36.
doi: 10.1038/nmeth.1768.

Evaluation of fluorophores for optimal performance in localization-based super-resolution imaging

Affiliations

Evaluation of fluorophores for optimal performance in localization-based super-resolution imaging

Graham T Dempsey et al. Nat Methods. .

Abstract

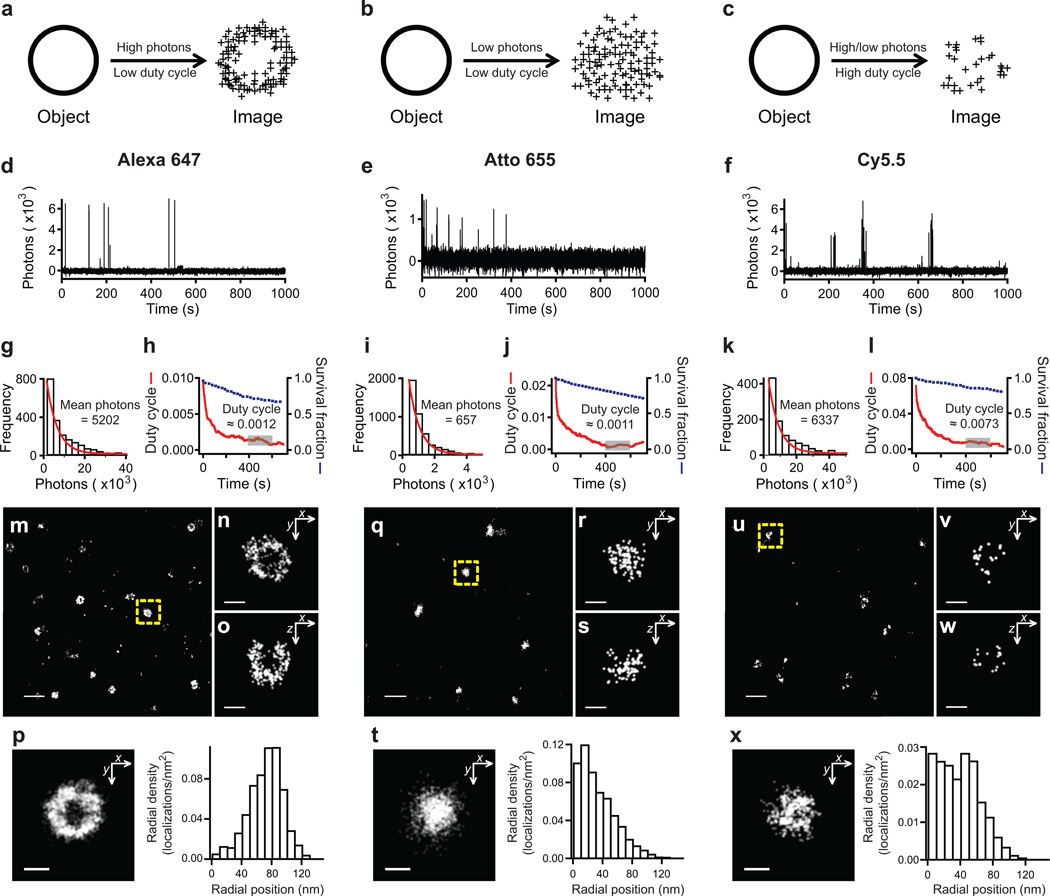
One approach to super-resolution fluorescence imaging uses sequential activation and localization of individual fluorophores to achieve high spatial resolution. Essential to this technique is the choice of fluorescent probes; the properties of the probes, including photons per switching event, on-off duty cycle, photostability and number of switching cycles, largely dictate the quality of super-resolution images. Although many probes have been reported, a systematic characterization of the properties of these probes and their impact on super-resolution image quality has been described in only a few cases. Here we quantitatively characterized the switching properties of 26 organic dyes and directly related these properties to the quality of super-resolution images. This analysis provides guidelines for characterization of super-resolution probes and a resource for selecting probes based on performance. Our evaluation identified several photoswitchable dyes with good to excellent performance in four independent spectral ranges, with which we demonstrated low-cross-talk, four-color super-resolution imaging.


Figures

Figure 1
Figure 1. Principle of single-molecule-localization-based super-resolution imaging and modes of switching used for this imaging method
(a) A structure (here a ring-like object) smaller than the diffraction-limited resolution is densely labeled with switchable fluorophores. When the fluorophores are imaged simultaneously, the spatial features of the structure are obscured by the overlapping fluorescence images of each molecule. However, the positions of individual molecules may be determined with high precision when the molecules are activated and imaged sequentially (fluorescent image indicated as a red circle whose center position is marked as a yellow ‘+’). By repeatedly activating and localizing different molecules labeling the structure, the sub-diffraction-limited spatial features can be resolved. (b) This principle can be performed by utilizing photoswitching or non-photoswitching modes. The first mode further includes reversibly switchable or irreversibly activatable fluorophores. The non-photoswitching mode can be achieved, for example, through reversible binding of fluorescently labeled ligands or chemical quenching of fluorescence.
Figure 2
Figure 2. Quantitative probe characterization for STORM imaging
(ac) The effect of number of detected photons per on-switching event and the on/off duty cycle (fraction of time in the on state) on STORM image quality for an example structure (a ring-like object). (a) A fluorophore with high photon number and low duty cycle produces a hollow, ring-like image with high localization precision and sufficient density. (b) A fluorophore with low photon number and low duty cycle maintains a large number of localizations, but suffers reduced localization accuracy, obscuring the ring-like structure. (c) A fluorophore with high on/off duty cycle requires reduction in the density of fluorescent probes to allow single-molecule localization, which in turn reduces the number of localizations and adversely affects the overall resolution. Single-molecule fluorescence time traces measured in the presence of βME and an oxygen scavenging system, as shown for three red-absorbing dyes (d) Alexa 647, (e) Atto 655, and (f) Cy5.5. Each of these dyes represents one of the scenarios described in (a–c). From these traces, the number of detected photons was determined for each switching event and a histogram was constructed from many events from hundreds of molecules (g,i,k). The indicated mean value was derived from the single exponential fit of the distribution (red curve). The on/off duty cycle value was calculated for each dye and plotted versus time (red curve; h,j,l) to show how each value begins high when most molecules are in the fluorescent state and reaches a quasi-equilibrium at a later time. The reported values are the average duty cycle measured between 400–600 sec (gray box). The fraction of molecules that survived photobleaching was plotted together with the duty cycle (blue squares). Images of clathrin-coated pits (CCPs) in 3D using the three dyes. (m–p) Alexa 647, (q–t) Atto 655, and (u–x) Cy5.5. The large fields of view shown in (m,q,u) are 2D projection images. The images of the CCPs indicated by the yellow dashed boxes are magnified and their xy cross-sections (n,r,v) and xz cross-sections (o,s,w) are shown. The composite xy cross-sections for ten CCPs aligned to their respective centers of mass are shown along with the radial density distributions of localizations derived from the composite xy cross-sections (p,t,x). Scale bars are 500 nm for (m,q,u) and 100 nm for (n–p, r–t, v–x).
Figure 3
Figure 3. Alexa 647 and Dyomics 654 resolve the hollow structure of immunostained microtubules
(a–b) STORM images of microtubules immunostained with Alexa 647 (a) and Dyomics 654 (b) and the partially overlaid conventional fluorescence images in the upper left corner of each image. (c–d) The transverse profiles of localizations corresponding to the yellowboxed regions in (a–b) illustrate the hollow cylindrical structure of the filament with a pronounced dip in the center (top panel corresponds to (a) and the bottom panel corresponds to (b)). Fitting of the profile by two Gaussian functions (red lines) gave the expected distances between the two peaks. Scale bars: 250 nm.
Figure 4
Figure 4. Four-color STORM imaging of in vitro assembled microtubule filaments and crosstalk analysis
(a) Four-color STORM image of in vitro assembled microtubules labeled with each of the four dyes, Atto 488 (green), Cy3B (magenta), Alexa 647 (cyan), and DyLight 750 (white). (b) Spectral separation of the four dyes, with the black vertical lines representing the excitation wavelength used and the gray regions highlighting the emission filter range for each of the dyes in (c–f). (c–f) Individual STORM images in each of the spectral regions for the boxed region in (a). (g) The crosstalk between channels measured from control microtubule samples (see Methods section for details). The asterisks indicate that the crosstalk was undetectable in those channels. Scale bars: 2 µm for (a) and 500 nm for (c–f).
Figure 5
Figure 5. Four-color STORM imaging of cellular structures
(a–d) Individual channels of a four-color image of Atto 488-labeled microtubules (green), Cy3B-labeled mitochondria (magenta), Alexa 647-labeled ER (cyan), and DyLight 750-labeled acetylated tubulin (white) within a single fixed cell. The dashed yellow box in each panel corresponds to the same region in the image. (e) Zoom-in of the Cy3B and Alexa 647 channels of the yellow-boxed region in (a–d) showing extensive contact between mitochondria and the ER. (f) Zoom-in of the Atto 488 and DyLight 750 channels of the same region show overlap of acetylated tubulin with a subset of microtubule filaments. Scale bars: 1 µm for (a–d) and 500 nm for (e–f).

References

    1. Hell SW. Far-field optical nanoscopy. Science. 2007;316:1153–1158. - PubMed
    1. Huang B, Babcock H, Zhuang X. Breaking the diffraction barrier: super-resolution imaging of cells. Cell. 2010;143:1047–1058. - PMC - PubMed
    1. Rust MJ, Bates M, Zhuang X. Sub-diffraction-limit imaging by stochastic optical reconstruction microscopy (STORM) Nat. Methods. 2006;3:793–796. - PMC - PubMed
    1. Betzig E, et al. Imaging intracellular fluorescent proteins at nanometer resolution. Science. 2006;313:1642–1645. - PubMed
    1. Hess ST, Girirajan TPK, Mason MD. Ultra-high resolution imaging by fluorescence photoactivation localization microscopy. Biophys. J. 2006;91:4258–4272. - PMC - PubMed

Publication types