. 2012 Jan-Feb;34(1):27-36.
doi: 10.1016/j.ntt.2011.10.003. Epub 2011 Oct 21.

Waterborne manganese exposure alters plasma, brain, and liver metabolites accompanied by changes in stereotypic behaviors

Affiliations

Waterborne manganese exposure alters plasma, brain, and liver metabolites accompanied by changes in stereotypic behaviors

Steve Fordahl et al. Neurotoxicol Teratol. 2012 Jan-Feb.

Abstract

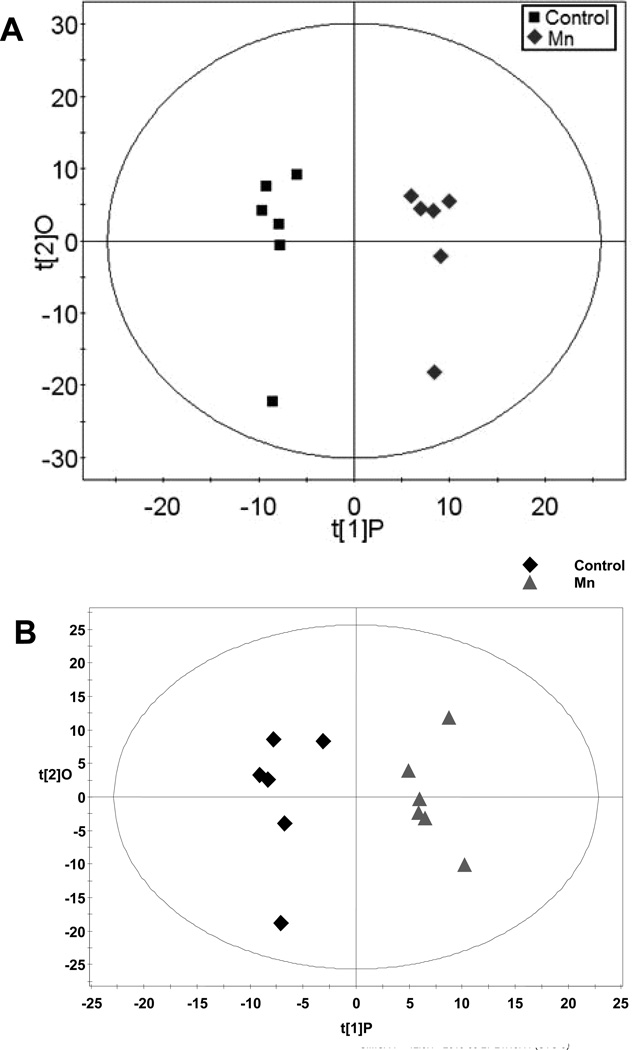
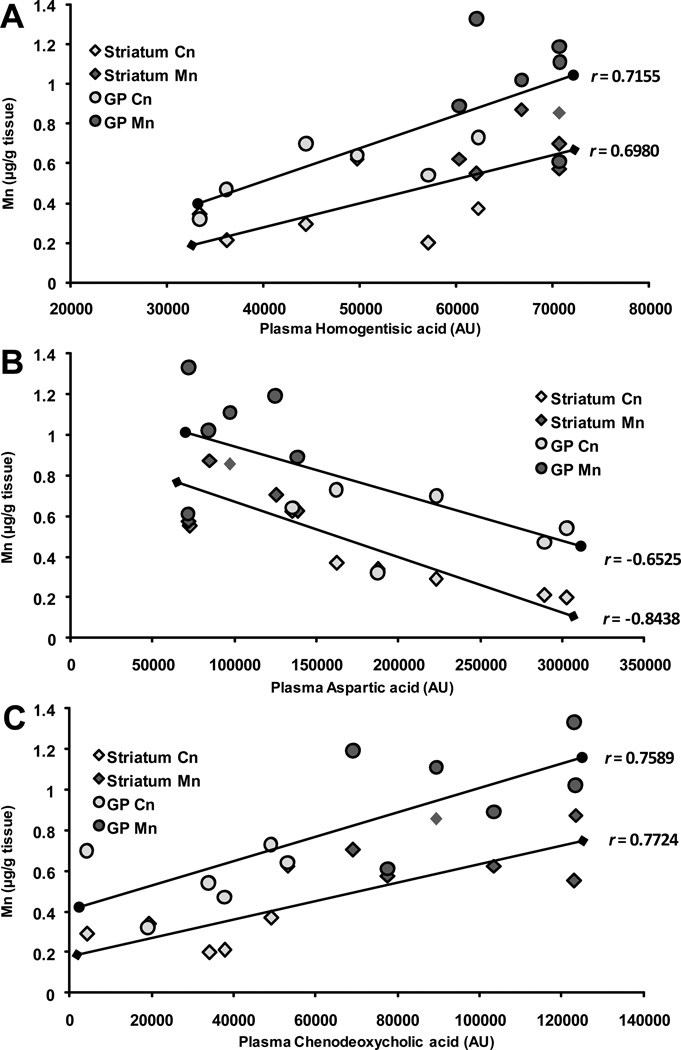
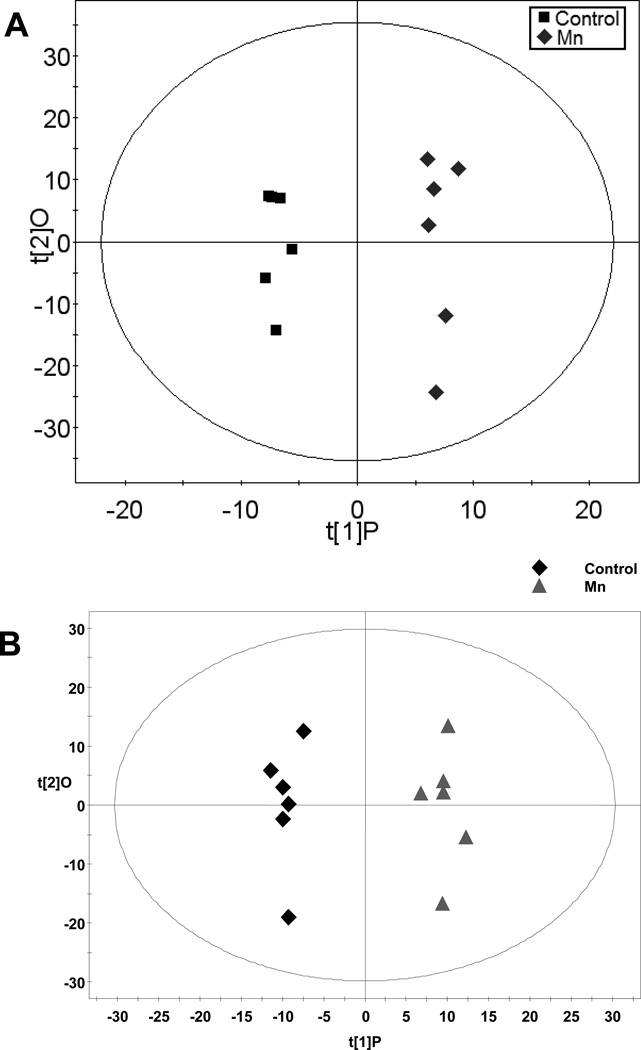
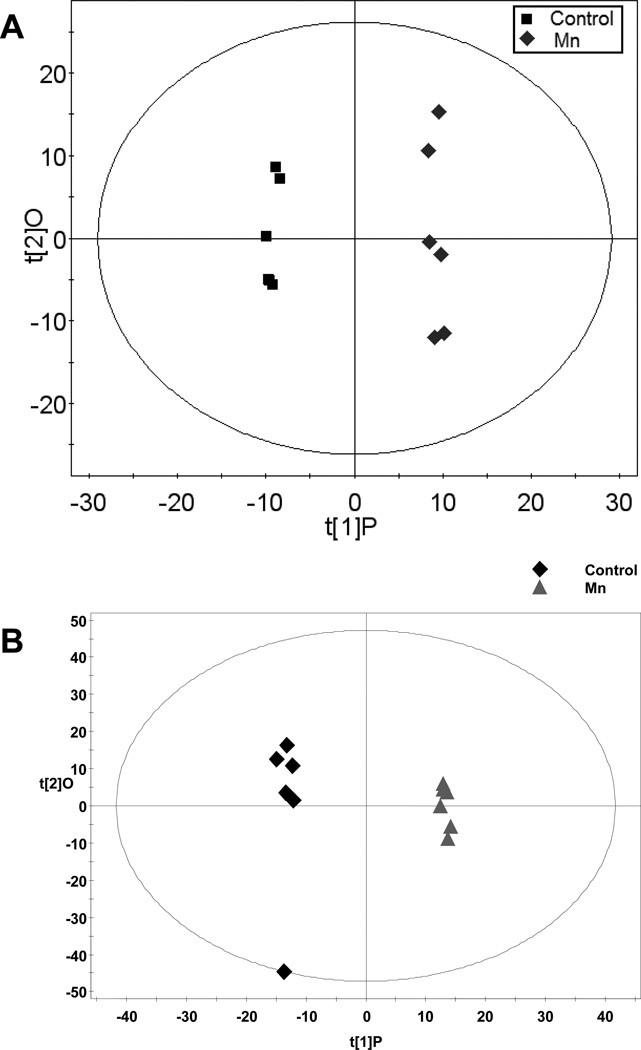
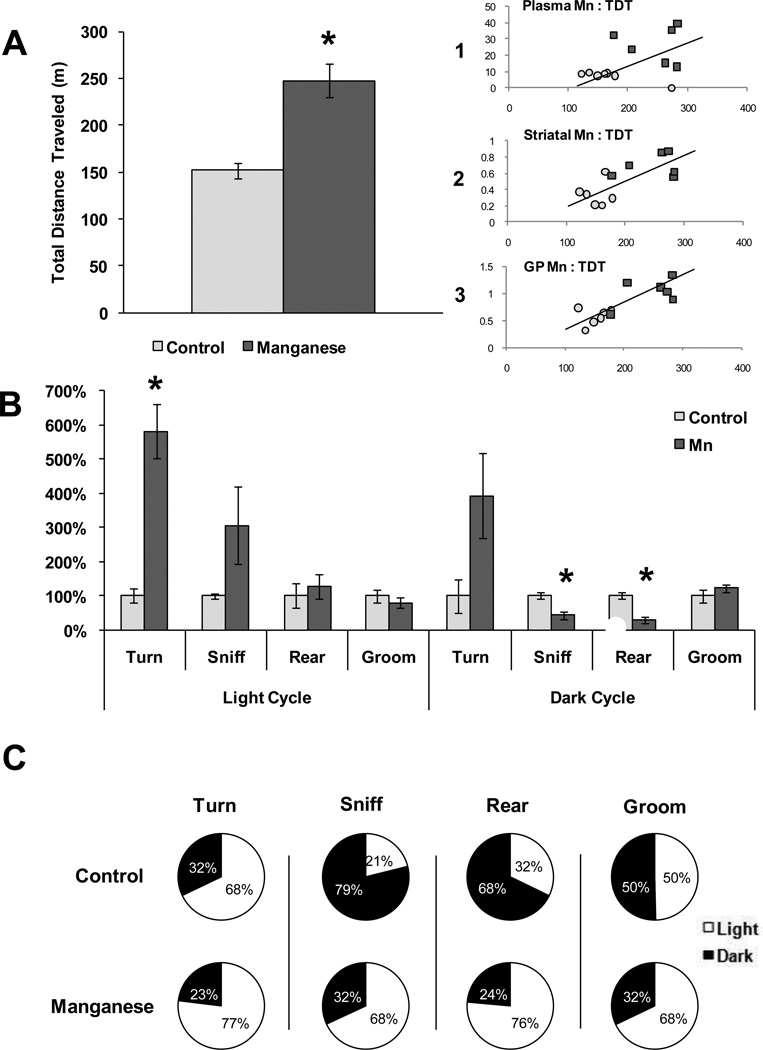
Overexposure to waterborne manganese (Mn) is linked with cognitive impairment in children and neurochemical abnormalities in other experimental models. In order to characterize the threshold between Mn-exposure and altered neurochemistry, it is important to identify biomarkers that positively correspond with brain Mn-accumulation. The objective of this study was to identify Mn-induced alterations in plasma, liver, and brain metabolites using liquid/gas chromatography-time of flight-mass spectrometry metabolomic analyses; and to monitor corresponding Mn-induced behavior changes. Weanling Sprague-Dawley rats had access to deionized drinking water either Mn-free or containing 1g Mn/L for 6 weeks. Behaviors were monitored during the sixth week for a continuous 24h period while in a home cage environment using video surveillance. Mn-exposure significantly increased liver, plasma, and brain Mn concentrations compared to control, specifically targeting the globus pallidus (GP). Mn significantly altered 98 metabolites in the brain, liver, and plasma; notably shifting cholesterol and fatty acid metabolism in the brain (increased oleic and palmitic acid; 12.57 and 15.48 fold change (FC), respectively), and liver (increased oleic acid, 14.51 FC; decreased hydroxybutyric acid, -14.29 FC). Additionally, Mn-altered plasma metabolites homogentisic acid, chenodeoxycholic acid, and aspartic acid correlated significantly with GP and striatal Mn. Total distance traveled was significantly increased and positively correlated with Mn-exposure, while nocturnal stereotypic and exploratory behaviors were reduced with Mn-exposure and performed largely during the light cycle compared to unexposed rats. These data provide putative biomarkers for Mn-neurotoxicity and suggest that Mn disrupts the circadian cycle in rats.


Conflict of interest statement

Disclosure Statement:

There are no conflicts of interest to be disclosed by any of the authors.

Figures

Figure 1
Figure 1. OPLS of Plasma Spectral Data
A) Gas chromatography-time of flight-mass spectroscopy (GC-TOFMS) data represented by OPLS-DA scores plot between control and Mn-exposed groups. OPLS-DA Model: Control vs Mn, 1+2 components, R2X (cum)=0.542, R2Xp = 0.152, R2Y (cum)=0.977, Q2(cum)=0.652. B) Liquid chromatography-time of flight mass spectroscopy (LC-TOFMS) data represented by the OPLS scores plot of the separation between healthy control and Mn-exposed rats. OPLS model: 2 component model, R2X=0.395, R2Y=0.934, Q2(cum)=0.554.
Figure 2
Figure 2. Relationships Between Brain Mn and Plasma Metabolites
Pearson’s correlational analysis was conducted between plasma metabolites altered by Mn and Mn levels in the striatum and globus pallidus (GP). Significant relationships emerged between striatal and GP Mn levels with A) plasma homogentisic acid, B) aspartic acid, and C) chenodeoxycholic acid, represented by arbitrary units (AU), and depicted in scatterplot form with best fit trendlines representing the Pearson’s r value for each plasma metabolite and brain region’s metal content. Control (Cn) (n=6) and Mn (n=6) groups were included in the analysis and are depicted by shades of gray on each plot.
Figure 3
Figure 3. OPLS of Brain Spectral Data
A) Gas chromatography-time of flight-mass spectroscopy (GC-TOFMS) data represented by OPLS-DA scores plot between control and Mn-exposed groups. OPLS-DA, Control vs Mn, 1+2 components, R2X (cum)=0.462, R2Xp = 0.153, R2Y (cum)=0.978, Q2(cum)=0.526. B) Liquid chromatography-time of flight mass spectroscopy (LC-TOFMS) data represented by the OPLS scores plot of the separation between healthy control and Mn-exposed rats. OPLS model: 2 component model, R2X=0.500, R2Y=0.979, Q2(cum)=0.642.
Figure 4
Figure 4. OPLS of Liver Spectral Data
A) Gas chromatography-time of flight-mass spectroscopy (GC-TOFMS) data represented by OPLS-DA scores plot between control and Mn-exposed groups. OPLS-DA Model: Control vs Mn, 1+2 components, R2X (cum)=0.454, R2Xp = 0.176, R2Y (cum)=0.996, Q2(cum)=0.695. B) Liquid chromatography-time of flight mass spectroscopy (LC-TOFMS) data represented by the OPLS scores plot of the separation between healthy control and Mn-exposed rats. OPLS model: 2 component model, R2X=0.391, R2Y=0.964, Q2(cum)=0.660.
Figure 5
Figure 5. Behavioral Analysis of Mn and Control Rats
Behaviors were monitored for 24 h using Home Cage Scan video surveillance during the sixth week of Mn-exposure. A) Total distance traveled (TDT) in meters over the 24 h period for control and Mn-exposed rats. Independent t-tests were used to identify differences between groups and data are expressed ± SEM. Inset) Scatter plot representation of Pearson’s correlational analysis between TDT (in meters; x axis) and 1) plasma Mn (µg/L; y axis) (r = 0.6229), 2) striatal Mn (µg/g; y axis) (r = 0.7212), and 3) globus pallidus (GP) Mn (µg/g; y axis) (r = 0.8027). B) Total behaviors expressed as percent control during the light and dark cycles using independent t-tests to identify differences between groups data are expressed ± SEM. (* = p < 0.01) C) Percentage of each behavior completed in the light or dark cycle for control and Mn-exposed rats.

References

    1. Anderson JG, Cooney PT, Erikson KM. Inhibition of DAT function attenuates manganese accumulation in the globus pallidus. Environ Tox Pharmacol. 2007;23:179–184. - PMC - PubMed
    1. Anderson JG, Fordahl SC, Cooney PT, Weaver TL, Colyer CL, Erikson KM. Manganese exposure alters extracellular GABA, GABA receptor and transporter protein and mRNA levels in the developing rat brain. NeuroTox. 2008;29:1044–1053. - PMC - PubMed
    1. Baquer NZ, Nothersall JS, Greenbaum AL, McLean P. The modifying effect of manganese on the enzymic profiles and pathways of carbohydrate metabolism in rat liver and adipose tissue during development. Biochm. Biophys. Res. Comm. 1974;62(3):634–641. - PubMed
    1. Bouchard MF, Laforest F, Vandelac L, Bellinger D, Mergler D. Hair Manganese and Hyperactive Behaviors: Pilot Study of School-Age Children Exposed through Tap Water. EHP. 2007;115(1):122–127. - PMC - PubMed
    1. Bouchard MF, Sauve S, Barbeau B, Legrand M, Brodeur M, Bouffard T, Limoges E, Bellinger DC, Mergler D. Intellectual Impairment in School-Age Children Exposed to Manganese from Drinking Water. EHP. 2011;119(1):138–143. - PMC - PubMed

Publication types

MeSH terms