. 2011 Dec 30;286(52):45014-29.
doi: 10.1074/jbc.M111.292896. Epub 2011 Nov 4.

The Src family kinase Fyn mediates hyperosmolarity-induced Mrp2 and Bsep retrieval from canalicular membrane

Affiliations

The Src family kinase Fyn mediates hyperosmolarity-induced Mrp2 and Bsep retrieval from canalicular membrane

Miriam Cantore et al. J Biol Chem. .

Abstract

In perfused rat liver, hyperosmolarity induces Mrp2- (Kubitz, R., D'urso, D., Keppler, D., and Häussinger, D. (1997) Gastroenterology 113, 1438-1442) and Bsep retrieval (Schmitt, M., Kubitz, R., Lizun, S., Wettstein, M., and Häussinger, D. (2001) Hepatology 33, 509-518) from the canalicular membrane leading to cholestasis. The aim of this study was to elucidate the underlying signaling events. Hyperosmolarity-induced retrieval of Mrp2 and Bsep from the canalicular membrane in perfused rat liver was accompanied by an activating phosphorylation of the Src kinases Fyn and Yes but not of c-Src. Both hyperosmotic transporter retrieval and Src kinase activation were sensitive to apocynin (300 μmol/liter), N-acetylcysteine (NAC; 10 mmol/liter), and SU6656 (1 μmol/liter). Also PP-2 (250 nmol/liter), which inhibited hyperosmotic Fyn but not Yes activation, prevented hyperosmotic transporter retrieval from the canalicular membrane, suggesting that Fyn but not Yes mediates hyperosmotic Bsep and Mrp2 retrieval. Neither hyperosmotic Fyn activation nor Bsep/Mrp2 retrieval was observed in livers from p47(phox) knock-out mice. Hyperosmotic activation of JNKs was sensitive to apocynin and NAC but insensitive to SU6656 and PP-2, indicating that JNKs are not involved in transporter retrieval, as also evidenced by experiments using the JNK inhibitors L-JNKI-1 and SP6001255, respectively. Hyperosmotic transporter retrieval was accompanied by a NAC and Fyn knockdown-sensitive inhibition of biliary excretion of the glutathione conjugate of 1-chloro-2,4-dinitrobenzene in perfused rat liver and of cholyl-L-lysyl-fluorescein secretion into the pseudocanaliculi formed by hepatocyte couplets. Hyperosmolarity triggered an association between Fyn and cortactin and increased the amount of phosphorylated cortactin underneath the canalicular membrane. It is concluded that the hyperosmotic cholestasis is triggered by a NADPH oxidase-driven reactive oxygen species formation that mediates Fyn-dependent retrieval of the Mrp2 and Bsep from the canalicular membrane, which may involve an increased cortactin phosphorylation.


Figures
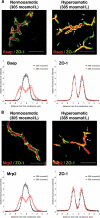
FIGURE 1.
FIGURE 1.
Immunohistochemical distribution of Bsep (A) and Mrp2 (B) in hyperosmotically perfused rat liver. Rat livers were perfused for 30 min with either normo- (305 mosmol/liter; ○) or hyperosmolar Krebs-Henseleit buffer (385 mosmol/liter; ■) and immunostained for Bsep (red) and ZO-1 (green) (A) or for Mrp2 (red) and ZO-1 (green) (B), as given under “Experimental Procedures.” Under normoosmotic conditions, Bsep (A) and Mrp2 (B) are largely localized between the linear ZO-1 staining/tight junction complex, whereas after hyperosmotic perfusion Bsep (A) and Mrp2 (B) appear aside the linear ZO-1 staining/tight junction complex (arrow) inside the cells. The pictures were obtained from single perfusion experiments. Experiments representative for a series of 12 individual experiments are shown. White bar = 10 μm. Densitometric analysis of fluorescence profiles and intensity of Bsep (A) and Mrp2 staining (B) is shown. Pictures were further analyzed densitometrically as described previously (17, 18). The ordinate shows normalized intensity of Bsep (A) or Mrp2-bound fluorescence (B) depending on the distance (μm) from the center of the canaliculus. Hyperosmotic perfusion (■, red graph) resulted in a significant lateralization of the Bsep (A)- or Mrp2-bound fluorescence (B). The fluorescence profiles depicted are statistically significantly (p < 0.05) different from each other with respect to variance and peak height. For control, livers were perfused for 30 min with normoosmotic medium (○, black graph). In these control experiments no significant change of Bsep (A) or Mrp2 fluorescence profiles (B) with respect of variance and peak height could be detected. Densitometric analysis of fluorescence profiles and intensity of ZO-1 staining (A and B) is shown. Distribution of ZO-1-bound fluorescence was analyzed at the canalicular area of longitudinally scanned canaliculi. The ordinate shows the normalized intensity of ZO-1 staining depending on the distance (μm) from the center of the canaliculus (set as 0). Under control conditions ZO-1 fluorescence profiles show two peaks, and liver perfusion experiments with either normo- (○, black graph) or hyperosmolarity (■, red graph) resulted in no significant changes of ZO-1 fluorescence profiles with respect to the distance of the peaks and to the variance of fluorescence profiles. Means of 40 measurements in each of the 12 individual experiments for each condition are shown (means ± S.E.). Statistical analysis was performed as described under “Experimental Procedures.”
FIGURE 2.
FIGURE 2.
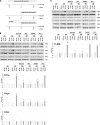
Hyperosmolarity-induced activation of Src and MAP kinases in the perfused rat liver. Rat livers were perfused as described under “Experimental Procedures,” and perfusion plans of the respective experiments are given in A. In detail, after 30 min of normoosmotic perfusion (305 mosmol/liter), a first liver tissue sample was taken (control, t −30 min). Then, livers were perfused for another 30 min under normoosmotic conditions in the absence or presence of the indicated inhibitors, and a second liver sample was taken (control, t 0 min or inhibitor, t 0 min). The inhibitors used were apocynin (300 μmol/liter), NAC (10 mmol/liter), SU6656 (1 μmol/liter), and PP-2 (250 nmol/liter). Thereafter, hyperosmolarity (385 mosmol/liter) was instituted for another 30 min, and a third liver tissue sample was removed (t 30 min). Liver samples were then analyzed for activation of Src kinase family members Yes, Fyn, and c-Src (B) and for activation of the MAP kinases JNK, p38MAPK, and Erk (C). Blots were analyzed densitometrically. t −30 min, i.e. sample before institution of either hyperosmolarity or inhibitor, was set to 1. Representative blots and densitometric analysis of three independent perfusion experiments are shown. B, in line with previous studies (26), hyperosmolarity induced within 30 min a significant phosphorylation of Yes and Fyn (#, p < 0.05, n = 3), whereas no c-Src activation was observed (p > 0.05, n = 3). Phosphorylation of Yes and Fyn was sensitive to apocynin and NAC (*, p > 0.05, n = 3). Yes and Fyn phosphorylation was inhibited by SU6655 (*, p < 0.05, n = 3), whereas PP-2 inhibited hyperosmotic Fyn (*, p < 0.05, n = 3) but not Yes activation (p > 0.05, n = 3). C, in line with the literature (24), hyperosmotic exposure led within 30 min to a phosphorylation of JNK (#, p < 0.05, n = 3), whereas no p38MAPK or Erk phosphorylation occurred (p > 0.05, n = 3; densitometric analysis not shown). This JNK activation was sensitive to apocynin and NAC (*, p < 0.05, n = 3). SU6656 and PP-2 had no effect on JNK phosphorylation (p > 0.05, n = 3).
FIGURE 3.
FIGURE 3.
Immunohistochemical determination of Bsep and ZO-1 distribution in hyperosmotic perfused rat livers. Rat livers were perfused for 30 min with either normoosmotic medium alone (305 mosmol/liter; ○) or in the presence of an inhibitor (▴, i.e. apocynin (300 μmol/liter; A), NAC (10 mmol/liter; B), SU6656 (1 μmol/liter; C), or PP-2 (250 nmol/liter; D)). Thereafter, livers were perfused for another 30 min with either normo- (305 mosmol/liter; ○, black symbols) or hyperosmolar Krebs-Henseleit buffer (385 mosmol/liter) in the absence (■, red symbols) or presence of the respective inhibitors (▴, blue symbols). Bsep (red) and ZO-1 (green) were then immunostained and analyzed as given in Fig. 1. The means of 10 measurements in each of the 3 individual experiments for each condition (A–D) are shown (means ± S.E.). Apocynin (A), NAC (B), SU6656 (C), and PP-2 (D) all significantly inhibit hyperosmolarity-induced retrieval of Bsep from the canalicular membrane (p < 0.05), whereas these inhibitors by themselves did not significantly affect Bsep localization (see supplemental Fig. 3A) (p > 0.05). Ten measurements in each of three independent experiments for each condition were performed.
FIGURE 4.
FIGURE 4.
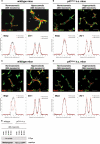
Immunohistochemical distribution of Bsep (A and B) and Mrp2 (C and D) and Fyn activation in hyperosmotically perfused wild type (A, C, and E) and p47phox knock-out mouse liver (B, D, and E). Mouse livers were perfused for 30 min with either normoosmotic (305 mosmol/liter; ■, black graph) or hyperosmolar Krebs-Henseleit buffer (385 mosmol/liter; ■, red graph) and immunostained for Bsep (red) and ZO-1 (green) (A and B) or for Mrp2 (red) and ZO-1 (green) (C and D), as described under “Experimental Procedures” and in the Fig. legend 1. The pictures refer to representative perfusion experiments. White bar = 10 μm. Under normoosmotic conditions, Bsep (A and B) and Mrp2 (C and D) are largely localized between the linear ZO-1 staining/tight junction complex, whereas after hyperosmotic perfusion Bsep (A, p < 0.05) and Mrp2 (C, p < 0.05) appear aside the linear ZO-1 staining/tight junction complex inside the cells in wild type animals (A and C) but remained unchanged in the p47phox knock-out mice (k.o., B and D). The means of 40 measurements in each of the 3 individual experiments for each condition are shown (means ± S.E.). Statistical analysis was performed as described under “Experimental Procedures.” E, in another set of experiments, livers from either wild type or p47phox knock-out mice were exposed to hyperosmotic medium (385 mosmol/liter), and liver samples were taken at the given time points. Fyn phosphorylation was detected by Western blot as described under “Experimental Procedures.” Representative blots of three independent perfusion experiments per condition are shown. Fyn phosphorylation occurs within 15 min of hyperosmotic exposure in livers from wild type animals, whereas no Fyn activation occurred within 60 min in livers from p47phox knock-out mice, indicating an involvement of NADPH oxidase in hyperosmotic Fyn activation.
FIGURE 5.
FIGURE 5.
Hyperosmolarity-induced decrease of CLF transport into pseudocanaliculi and NAC sensitivity of Fyn activation in primary rat hepatocyte couplets. Primary rat hepatocyte couplets were prepared and cultured as described under “Experimental Procedures.” A–D, at the beginning of the experiment, normoosmotic (305 mosmol/liter) or hyperosmotic medium (405 mosmol/liter) was instituted for 30 min. When indicated, NAC (30 mm) or PP-2 (5 μm) was added to the medium for 30 min. Thereafter, hepatocyte couplets were transferred to an inverted fluorescence microscope and challenged with the fluorescent bile salt derivative CLF (0.5 μmol/liter). CLF fluorescence was continuously monitored in the cytosol (△ and the pseudocanaliculus (○) formed by the hepatocyte couplet. Mean fluorescence during the first minute of recording was set to 1. Data are given as the means ± S.E. (n = 3 for each condition). A, under normoosmotic conditions, CLF accumulates predominantly in the pseudocanaliculus. B, under hyperosmotic conditions, the amount of CLF in the pseudocanaliculus decreases compared with normoosmotic control, whereas CLF fluorescence in the cytosol is increased. C and D, hyperosmolarity-induced decrease of CLF transport into the pseudocanaliculus was abolished in the presence of either NAC (C) or PP-2 (D), suggesting an involvement of ROS and Src kinases in this setting. E, hepatocyte couplets were exposed to hyperosmolarity (405 mosmol/liter) for the indicated time periods. When indicated, NAC (30 mm) was present for 30 min before institution of hyperosmolarity. Activation of Fyn was analyzed densitometrically as described under “Experimental Procedures.” Respective Blots of three independent experiments are given. Hyperosmolarity induced within 10 min a significant Fyn phosphorylation that lasted for up to 180 min (*, p < 0.05, n = 3). This hyperosmotic Fyn activation in 6-h-cultured rat hepatocyte couplets was significantly inhibited by NAC (#, p < 0.05, n = 3).
FIGURE 6.
FIGURE 6.
Hyperosmolarity-induced decrease of CLF transport into pseudocanaliculi is blunted in primary rat hepatocyte couplets after Fyn knockdown. Primary rat hepatocyte couplets were isolated, kept in culture, and treated with either nonsense (A, B, and C; control) or Fyn siRNA for 72 h (A, D, and E; Fyn knockdown) as described under “Experimental Procedures.” Measurements were performed as described in the Fig. 5 legend. CLF fluorescence was continuously monitored in the cytosol (△) and the pseudocanaliculus (○) formed by the hepatocyte couplet. Mean fluorescence during the first minute of recording was set as 1. Data are given as the means ± S.E. (n = 3 for each condition). A, Fyn knockdown was achieved after 72 h of Fyn siRNA treatment, whereas Fyn expression remained unchanged in hepatocyte couplets exposed to nonsense siRNA as detected by Western blot. GAPDH served as a loading control and was not affected by Fyn siRNA treatment. Representative blots of three independent experiments are shown. B and C, in control cells, CLF accumulates predominantly in the pseudocanaliculus under normoosmotic conditions (B, 305 mosmol/liter), whereas hyperosmolarity (C, 405 mosmol/liter) decreases CLF fluorescence in the pseudocanaliculus when compared with the normoosmotic control condition and increases CLF fluorescence in the cytosol. D and E, in hepatocyte couplets with Fyn knockdown, the hyperosmolarity-induced decrease of CLF transport into the pseudocanaliculus was abolished (E) compared with normoosmotic conditions (D).
FIGURE 7.
FIGURE 7.
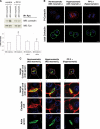
Hyperosmolarity-induced Fyn/cortactin association (A), cortactin tyrosine phosphorylation (B), and reduction of cortactin/actin association (C) in rat hepatocytes. Primary rat hepatocytes (A) or hepatocyte couplets (B and C) were isolated and cultured as described under “Experimental Procedures.” At the beginning of the experiment, normoosmotic (305 mosmol/liter) or hyperosmotic medium (405 mosmol/liter) was instituted for 30 min. When indicated, PP-2 (5 μmol/liter) was added to the medium for 30 min. At the end of the experiment cells were either transferred for Fyn immunoprecipitation (A) or to immunostaining of either phospho-cortactin-Tyr-421 (red) or total cortactin (green) (B) or total cortactin (red) and phalloidin-FITC (green), respectively, to visualize the actin cytoskeleton (C). Cell nuclei were stained using DAPI (blue) (B and C). A, after Fyn immunoprecipitation (IP), samples were tested for Fyn/cortactin association by cortactin Western blot (WB). Fyn Western blots served as loading controls. Hyperosmolarity led within 30 min to a significant increase in Fyn/cortactin association (n = 5, p < 0.05) that was sensitive to PP-2 (n = 5, p < 0.05). B, compared with normoosmotic control (left column), hyperosmolarity (middle column) induces a PP-2-sensitive increase in cortactin tyrosine phosphorylation (upper row), whereas total cortactin remains unchanged (lower row) (n = 5). White bar = 10 μm. C, whereas a strong colocalization of cortactin and actin was visible under normoosmotic conditions, hyperosmolarity induced a dissociation of cortactin and actin mainly at the pseudocanalicular region in a PP-2-sensitive way. Representative immunostainings of three independent experiments are shown (n = 3). The upper lane represents a low magnification showing the respective hepatocyte couplet (white bar = 5 μm). The three lower lanes show a confocal section of the pseudocanaliculus (white bar = 5 μm).
FIGURE 8.
FIGURE 8.
Hyperosmolarity-induced Bsep and Mrp2 retrieval out of the canalicular membrane requires NADPH oxidase-driven ROS formation and subsequent Fyn activation. Fig, 6 summarizes our findings. Hyperosmolarity-induced Yes, Fyn, and JNK activation were sensitive to inhibition of NADPH oxidase and to the antioxidant NAC, indicating an involvement of NADPH oxidase-driven ROS formation in the hyperosmotic Yes, Fyn, and JNK activation. PP-2 inhibits hyperosmotic Fyn but not Yes and JNK activation. Fyn then mediates the hyperosmotic-induced retrieval of canalicular Bsep and Mrp2. ROS-mediated Yes activation leads to an EGFR transactivation (26). JNK, which is also activated by hyperosmolarity, then provides a signal for EGFR/CD95 association and subsequent CD95 tyrosine phosphorylation followed by CD95 membrane translocation and DISC (death-inducing signaling complex) formation (24, 26). Therefore, Yes and JNK play a crucial role in hyperosmolarity-induced CD95 activation, whereas Fyn triggers cholestasis. k.o., knock-out.

References

    1. Keppler D., Konig J. (1997) FASEB J. 11, 509–516 - PubMed
    1. Gatmaitan Z. C., Arias I. M. (1995) Physiol. Rev. 75, 261–275 - PubMed
    1. Müller M., Jansen P. L. (1997) Am. J. Physiol. 272, 1285–1303 - PubMed
    1. Meier P. J. (1995) Am. J. Physiol. 268, 801–812 - PubMed
    1. Vos T. A., Hooiveld G. J., Koning H., Childs S., Meijer D. K., Moshage H., Jansen P. L., Müller M. (1998) Hepatology 28, 1637–1644 - PubMed

Publication types

MeSH terms